

How to Add Tables to Your Substack Posts (Without Using Screenshots)
Substack doesn’t support tables, but this free tool makes it easy to embed them anyway.

Most publishing platforms let you add tables with just a click.
Substack doesn’t. 😒
If you’ve ever tried to include a table in your Substack post, you’ve probably run into the same frustrating options:
Upload a blurry screenshot.
Try to hack something together with spacing (that breaks on mobile).
Just skip the table entirely.
But tables are too useful to give up on entirely. Whether you’re comparing prices, summarizing research, or laying out pros and cons, a good table makes your post clearer, more professional, and easier to read.
Luckily, there’s a better way…and it’s free.
Why Use Tables in Your Substack Posts
Tables are one of the simplest ways to organize any structured information, not just numbers.
Whether you’re writing about business trends, wellness routines, or research insights, tables can help you:
Compare pricing plans or product features.
Summarize pros and cons.
Lay out a publishing schedule or project roadmap.
List tools, resources, or reading recommendations.
Highlight before-and-after results or milestones.
Unlike plain text or long paragraphs, tables make it easy for readers to scan, compare, and understand key points at a glance. They add structure to your writing and boost credibility, especially when you’re sharing data-backed ideas or helping readers make informed decisions.
If you’re writing posts that include options, rankings, or breakdowns, chances are a table will make your content clearer and more impactful.
The Problem: Substack Doesn’t Support Tables
Despite being a go-to platform for writers, Substack still doesn’t offer a native table block in its editor. That means you can’t just insert a table the way you would in Google Docs, Notion, or WordPress.
That leaves you with three main options, none of them great:
Skip the table entirely → Your post lacks clarity and structure.
Use spacing to fake a table → Looks broken on mobile and is difficult to read without the lines.
Paste a screenshot → Loses accessibility, readability, and SEO value.
If you want to present your data in a way that’s readable, responsive, and searchable, you need something better.
Why Screenshots Don’t Cut It
Screenshots might feel like the easiest fix—just snap your table and upload it as an image—but they come with serious trade-offs.
They’re not accessible: Screen readers can’t interpret images of text, so your table becomes invisible to anyone using assistive tech.
They’re not mobile-friendly: What looks fine on your desktop might shrink down to an unreadable blur on a phone.
They’re bad for SEO (and AI readability): Search engines, Substack’s discovery tools, and AI assistants typically can’t read the text inside images. If your key data is locked in a screenshot, it likely won’t show up in search results or summaries.
They’re hard to update: If you make a typo or want to update your numbers later, you’ll need to recreate and re-upload the image.
Screenshots are static, limited, and outdated. Fortunately, there’s a better (and free) way, and it only takes a few minutes to set up.
The Better Way: Use Datawrapper to Embed Responsive Tables
Instead of screenshots, use Datawrapper, a free tool that lets you create beautiful, responsive tables you can embed right into your Substack post.
It takes just a few minutes and works seamlessly on both desktop and mobile. Best of all, you can update the data anytime without editing your post; the embed stays live and up to date.
1. Start using Datawrapper for free.
Go to datawrapper.de and click Start creating.

2. Upload your data.
If you’ve already created your data in a spreadsheet, you can upload or link it now, but you can also add your data directly to Datawrapper.
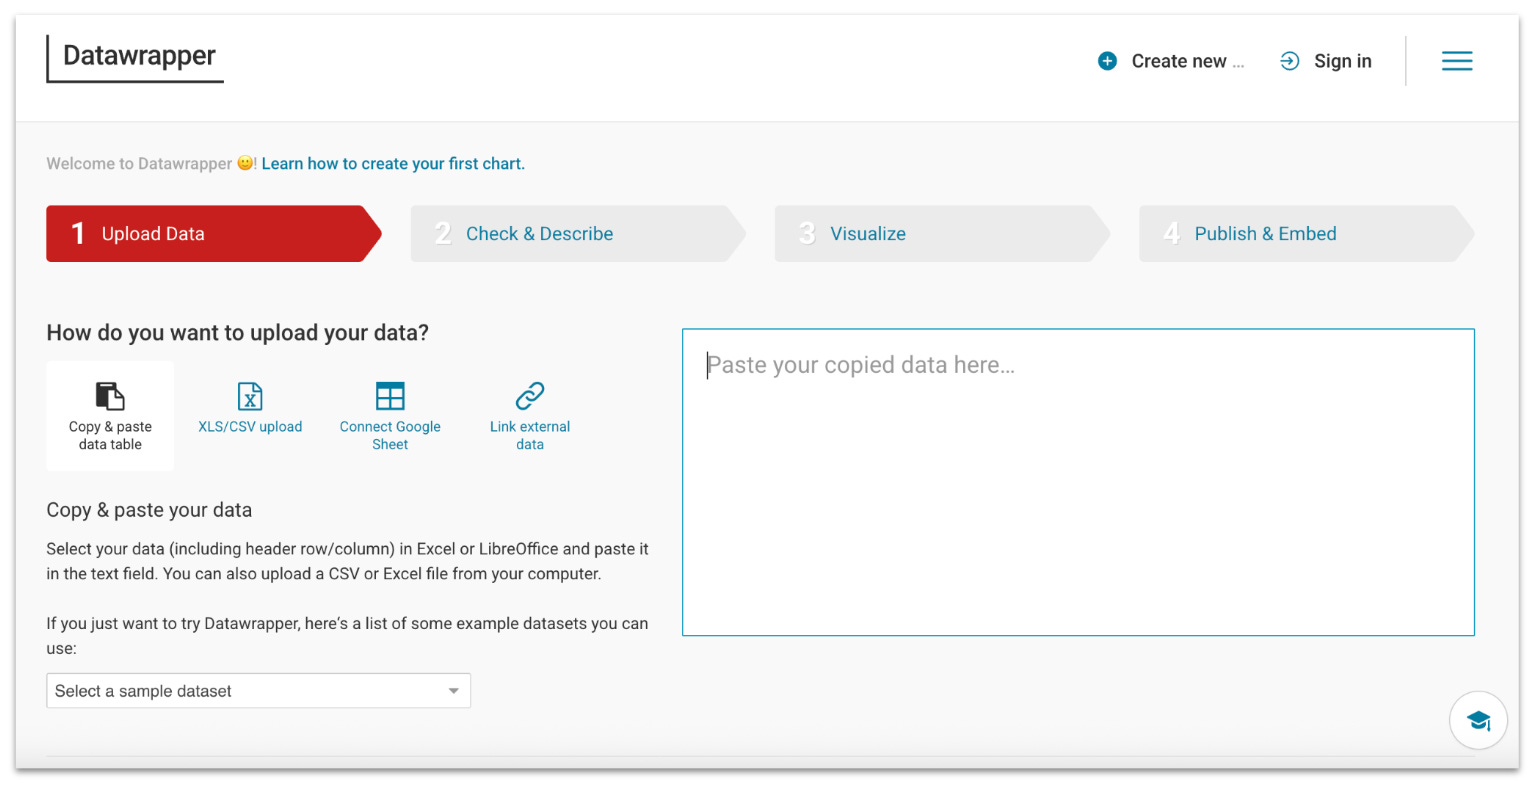
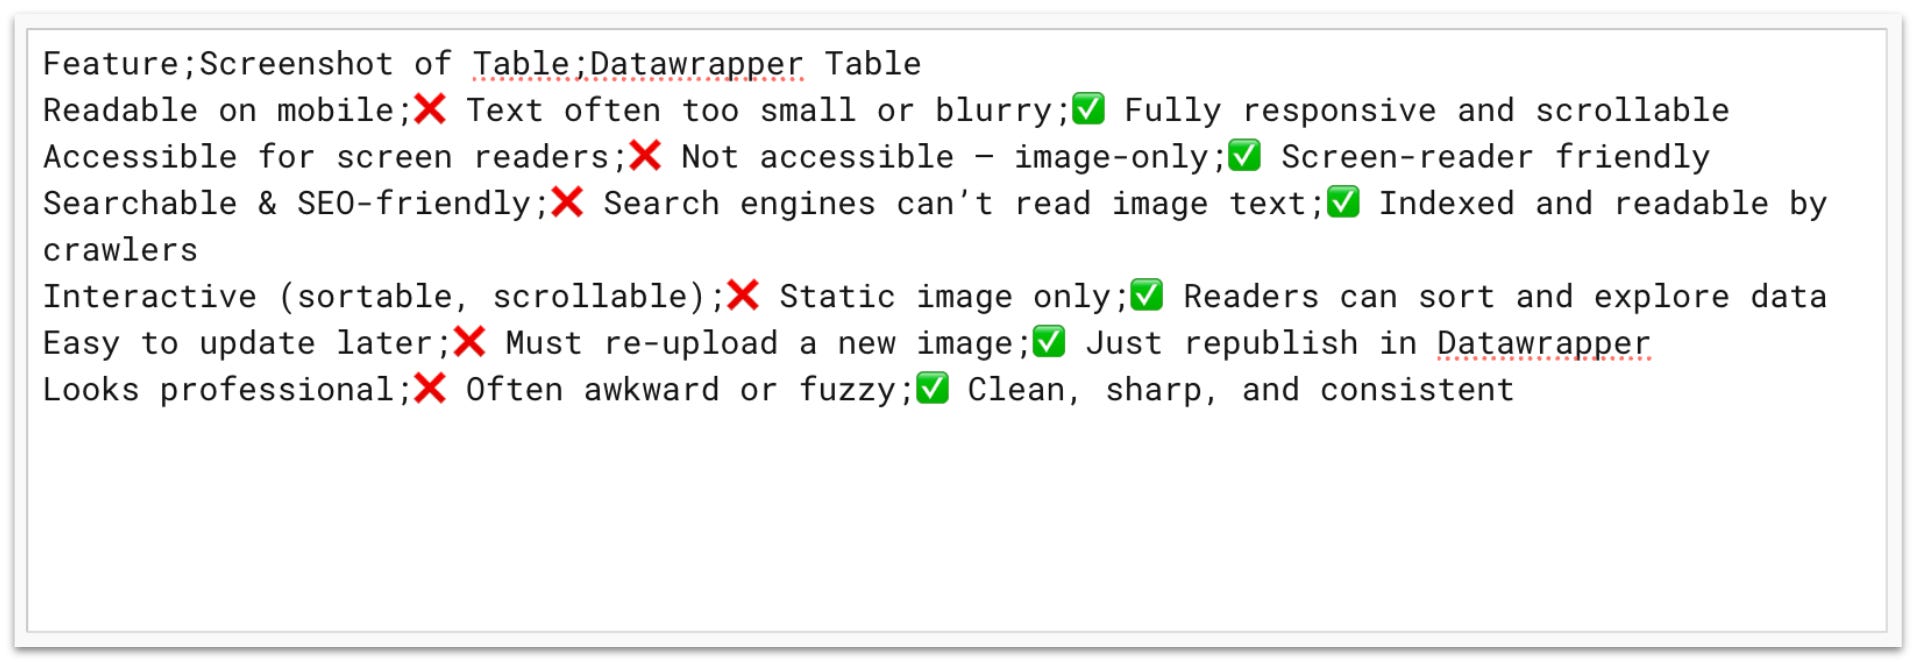
To add your data manually, write each row of your table on a new line, with a semicolon between each cell. The first row will be used as your column headers.
3. Check your data.
Next, Datawrapper will show you your data in table format so you can confirm everything looks as it should. It you see any issues, navigate back to the “Upload Data” tab to fix them before moving on.

4. Select table as your chart type.
Next, select your chart type, in this case: “Table.”

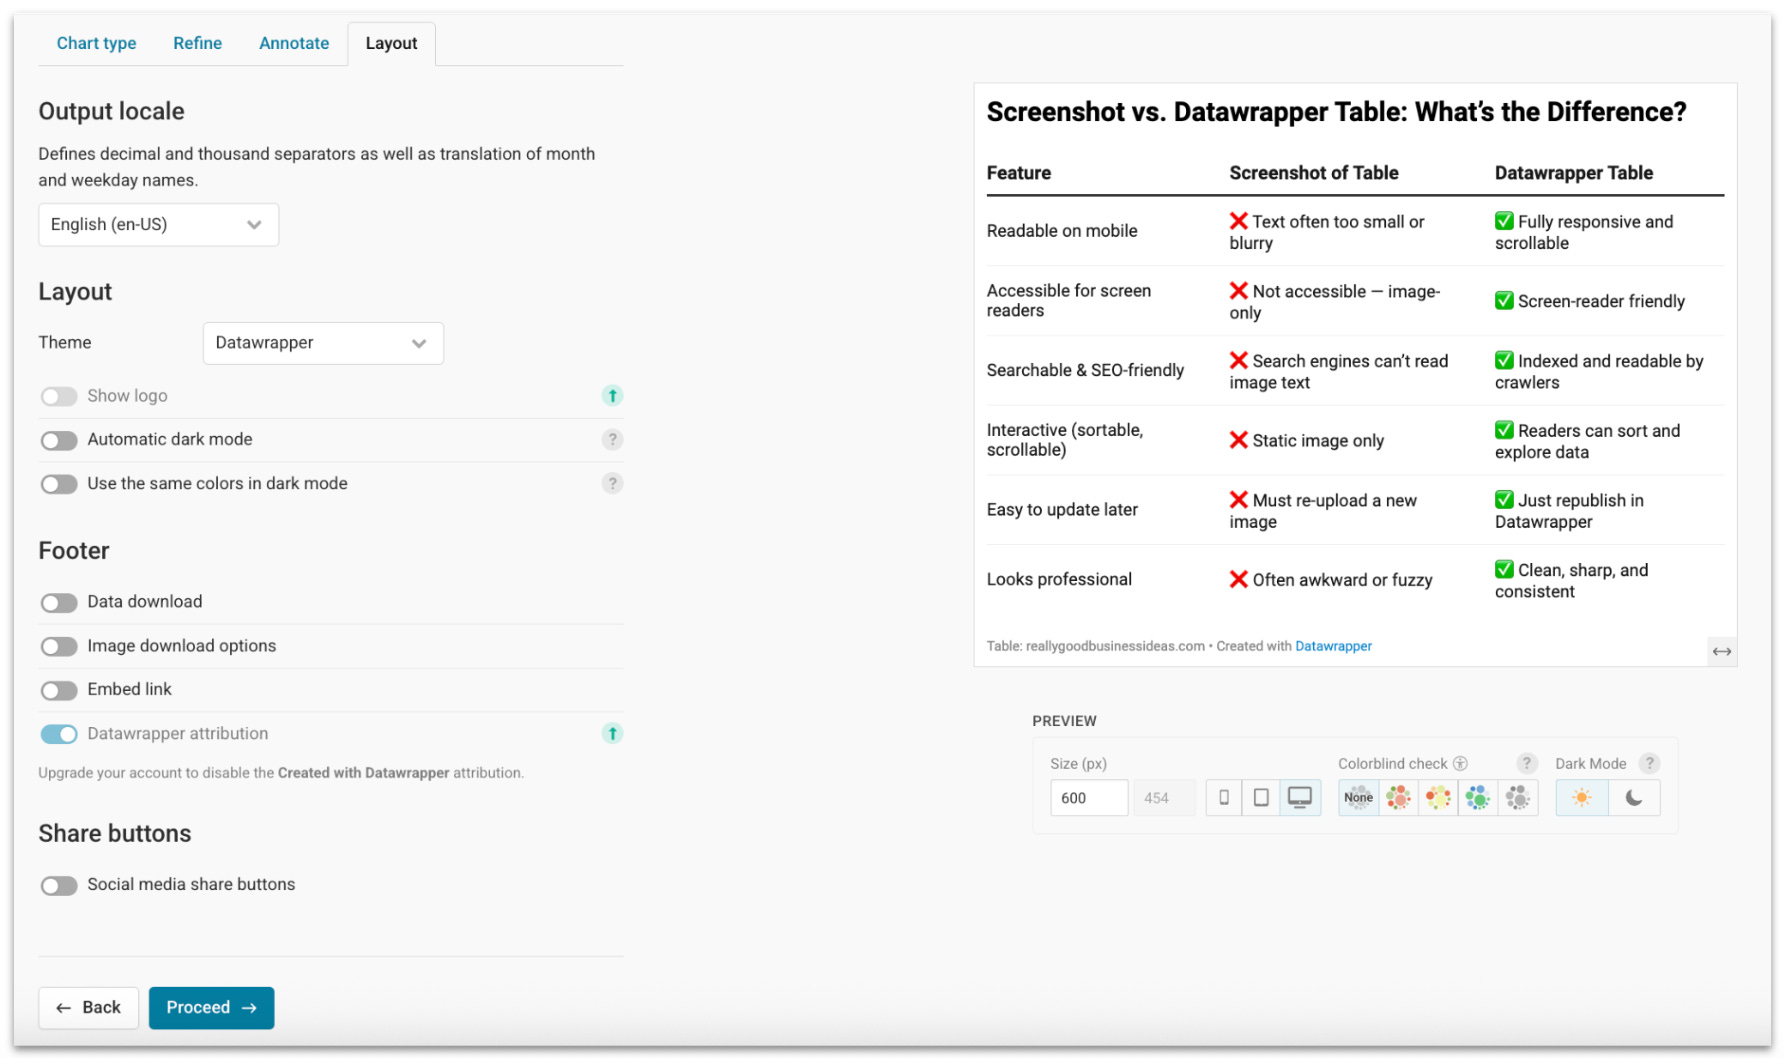
5. Customize your table.
This is where Datawrapper excels. There are many features you can use to customize Datawrapper charts, but these are the most important ones to look at for your tables.
Refine Table: Since I’m not using any numerical data, I turned off “Make sortable” for each column so users can’t change the row order of my table.

Annotate Table: In the “Annotate” tab, fill in your table’s “Title” and “Byline.”

Layout Settings: Finally, I turned off the download and share buttons on my table since I don’t want people using it without my permission.
6. Publish and get your embed link
Once everything looks good, click “Proceed” to publish your chart. You’ll be prompted to create an account, but since I already have an account, I simply logged in.
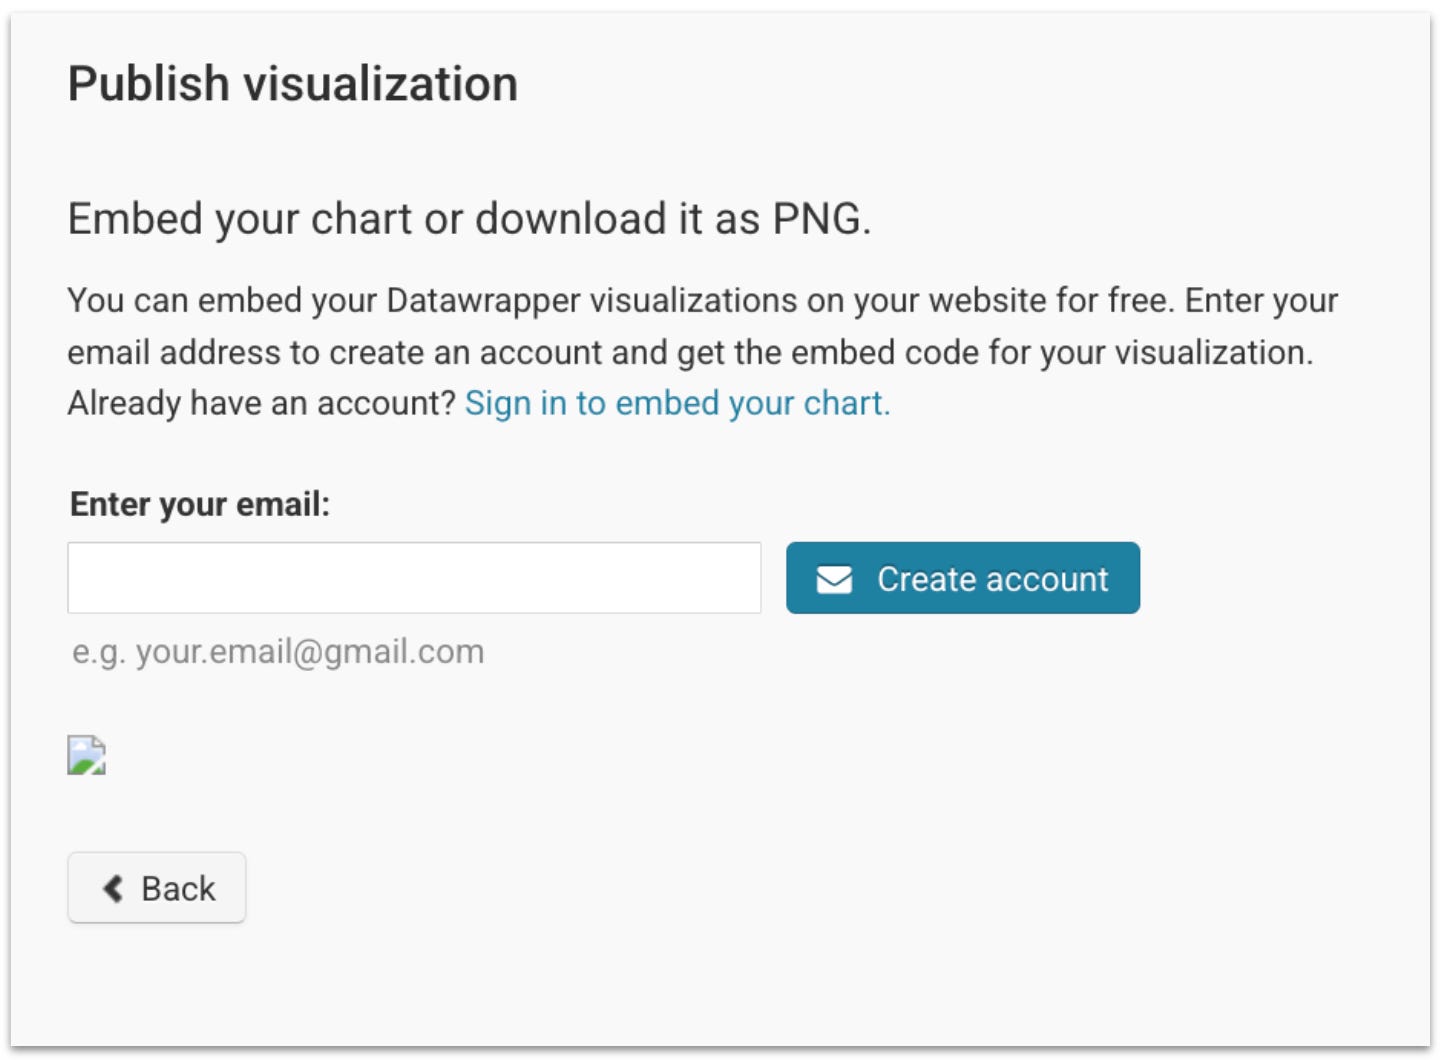
After you’ve created your account, click “Publish now.” You’ll receive a simple URL that you can paste directly into the Substack editor to embed your table.

6. Paste the embed in Substack
Now all you have to do is navigate to where you want your table to appear and paste the link! Substack will take care of the rest.
Your table will look professional on both web and mobile, and will give your readers the ability to sort and interact with the data, all without breaking your post layout.
Here’s the live version of the table we just built!
Better Tables Make Better Posts
Substack might not support tables out of the box, but that doesn’t mean your content has to suffer.
With Datawrapper, you can:
Share clean, readable tables.
Let readers sort, scan, and explore your data.
Keep your content accessible, mobile-friendly, and SEO-friendly.
So next time you’re tempted to upload another table screenshot…don’t, and use Datawrapper instead.
To endless possibilities,
Casandra

Great info thanks. I’ll give it a go
What a great tip!! Thanks for sharing Casandra.