

🧰 How I Optimize My Content Using Google Search Console
Rank higher in Google and capture more search traffic.

👋 Hey, I’m Casandra. I share research-backed business ideas to help you start and grow a business. This is a 🔒 Premium Edition 🔒 of Really Good Business Ideas.
You need to use Google Search Console if you want to grow your traffic.
Google search is the single biggest source of traffic1, and Google Search Console can help you maximize your search performance. Did I mention it’s totally free?
Last week, we discussed how to set up Google Search Console so you can start collecting data about your website’s search performance. If you’re just joining us, first click this link and get your Google Search Console up and running.

One of the most useful things you can do with Search Console is identify opportunities to optimize your content in order to increase your search traffic and conversions.
However, if you have a brand new content website, you should focus on creating content first. Once you’ve been publishing for a few months, you can start to think about optimizing your archive.
Google Search Console Search Performance Dashboard
The search performance dashboard in Google Search Console is my most used feature, and today, I’ll show you why.
There are four metrics you can analyze in the search performance dashboard:
Total Impressions describes how often your website showed up in the search results.
Total Clicks describes how often a searcher clicks on your website in the search results.
Average CTR, which stands for clickthrough rate, describes the average rate at which people who saw your website in the search results clicked on it.
Average position describes your website’s average position in the search engine results. 1 is at the very top, while anything higher than 11 is on the second page of search results.
Below is the search performance data for the first few weeks of Really Good Business Ideas.
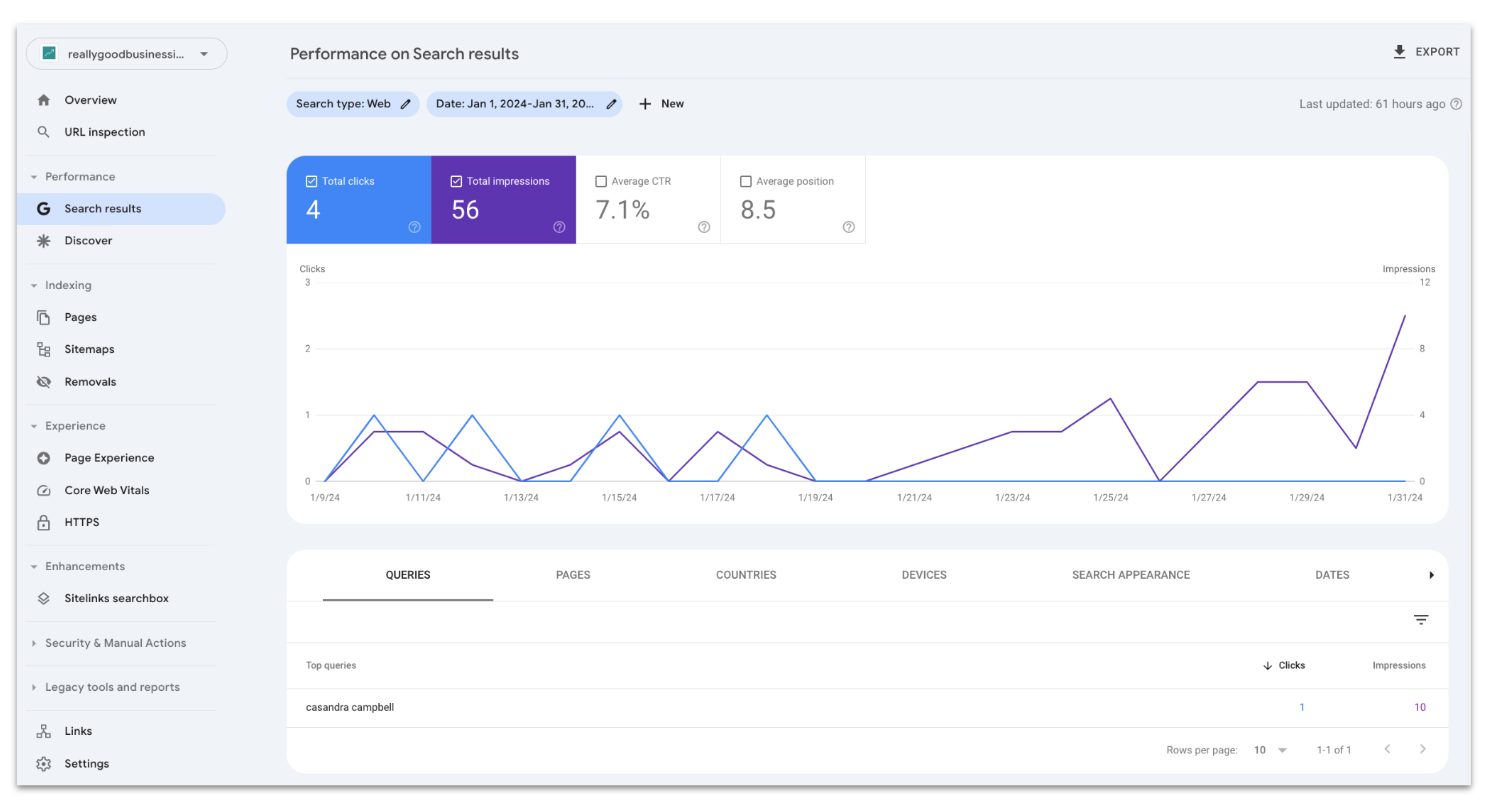
The graph is really useful for spotting trends in impressions and clicks over time (ideally the line will go up and to the right).
But if you really want to optimize your content, you need to segment the data. Each metric can be segmented by up to seven different dimensions:
Search type: Which tab in Google a searcher looked at from Web, Image, Video, News.
Date: Any date range between 3 days ago and 16 months ago.
Queries: The keywords that were searched.
Pages: The pages on your website that ranked.
Countries: The countries searchers were in.
Devices: The device a searcher used from desktop, mobile, or tablet.
Search Appearance: How your website displayed in the search results.2 For example, as a product snippet or translated results.
While the Search type and Date can be selected at the of the graph, the other dimensions must be selected through the appropriate tab in the table below the graph.
Right away, I can see the Queries I was ranking for in January 2024. Since my website was brand new and didn’t have much content yet, my name (“Casandra Campbell”) was the only keyword I ranked for.
When I click on the keyword, the graph updates to show data only for this keyword, including average position in the search results.

My name's average position was about 5, which makes sense since things like my personal website and LinkedIn profile were likely in positions 1-4.
If I toggle over to the Pages tab, I can see which pages were ranking for that keyword:

If I then wanted to see all the pages ranking during that time frame, regardless of keyword, I could remove the keyword from the filters at the top to see the full list.

If you’ve never used Google Search Console before, I really recommend playing around with these filters in different combinations to get more comfortable with the dashboard’s appearance and data. And if you’ve been publishing for a while, you’ll probably have tons of insights waiting to be discovered!
PS. If you’re unfamiliar with keyword research and how keywords work, I recommend reading this before continuing.

