

How I Use Google Trends to Explore Business, Product, Content, and Marketing Ideas
The best part is that it's totally free!

Hey, I’m Casandra. Welcome to a ✨ free edition ✨ of my newsletter. I share really good business ideas to help you start and grow a business.
Become a premium subscriber to access the full archive (including research-backed business ideas). Premium subscribers also get access to Premium Perks.
Google Trends is the most underrated business research tool you’re missing out on.
It’s extremely easy to use.
It uses a massive dataset, so the results are reliable.
It’s available using a public website so results are easy to share.
And best of all, it’s totally free.
That’s why Google Trends is always my first stop when exploring a new idea. It doesn’t matter if it’s a business idea, product idea, marketing idea, or even just something I’m curious about; Google Trends always has something interesting and useful to show me.
What Exactly Is Google Trends Data?
Google Trends data is a snapshot of what people search for on Google. It shows how popular specific search terms are over time and across different regions. This data is anonymized, meaning it doesn't reveal specific individuals' search history but shows overall trends.
And it’s a goldmine for understanding trends.
But, like any dataset, it’s essential to understand how the data is collected and analyzed so you don’t misinterpret it and draw the wrong conclusions.
Google Trends Uses Sampled Data
Google Trends can generate results quickly because it looks at a representative sample of data to determine the relative search interest of a keyword.1 This won’t affect how you use Google Trends, but it’s important to know.
Google Trends Shows Relative Search Interest
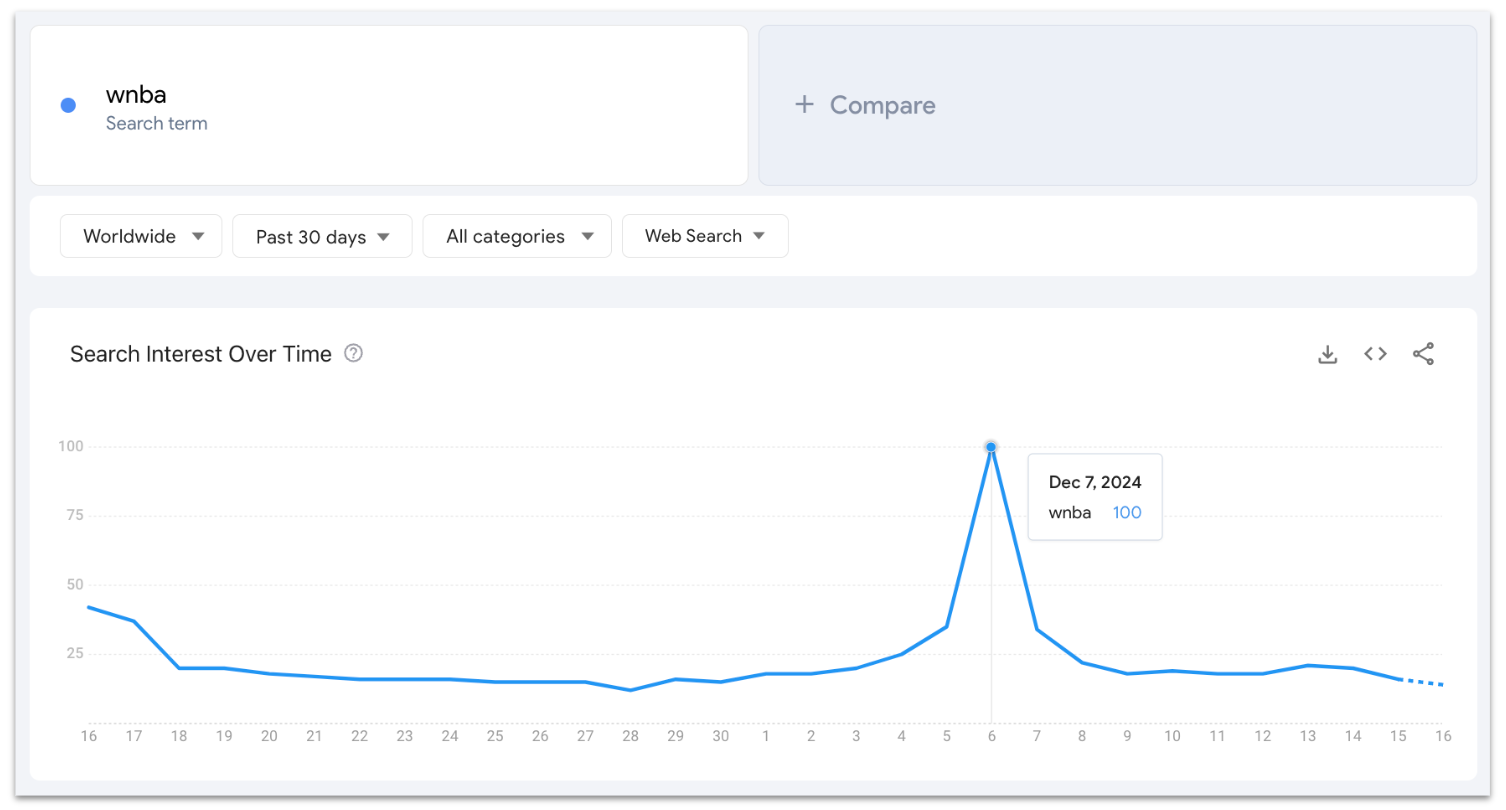
Google Trends indexes search interest data on a scale between 0 and 100. 100 will always be the highest point of any trend on the chart. Everything else on the chart will be scaled using this index.
This index is dynamic, so it can change as you change the variables on the chart. However, it’s important to know that the relative relationships between different days or keywords are stable.
For example, when we look at search interest for “wnba” over the last seven days, the highest day of search interest was on December 7, 2024, so that becomes 100.
But when we change the timeframe to the last twelve months, May 12–18, 2024, is the highest point and that becomes 100 instead. Compared to the week of May 12, 2024, the blip on December 7, 2024 is nothing.

And when we add “nba” as a comparison, it takes over, with the new highest point being search interest for “nba” during the week of April 28, 2024.

Although the placement of “wbna” search interest on the scale from 0 to 100 keeps changing, the relative relationship between different data points is the same. If it doubles from one day to the next, the index will always show a doubling, whether it jumps from 1 to 2, 50 to 100, or something in between.
There Are Two Types of Google Trends Keywords
Google Trends offers two types of keyword searches to help you get exactly what you’re looking for.2
1. Search terms
When you explore a keyword as a Search term, Google Trends will show all the searches that include that term as written.
The words can appear in any order.
The words can be part of longer phrases.
Variations and translations will not be included.
Google will not discriminate by intent.
2. Topics
When you explore a keyword as a specific Topic (e.g., Software company, Baseball team), it will only show data for searches related to that particular Topic.
Data is limited to searches for the specific Topic.
The words can be part of longer phrases.
Translations, misspellings, and variations are included.
It’s important to note that the algorithm groups searches into Topics that are not perfect. If you see something strange, it may be a data quality issue related to this clustering.
The best example I’ve seen to illustrate the difference between Search terms and Topics is the keyword “apple.”
When you select “Apple” the Technology company, Google Trends will only show search interest related to the company that gave us the iPhone.
When you select “Apple” the Fruit, Google Trends will only search interest related to the apples we eat.
When you select “apple” the Search term it will show any searches with the term apple, regardless of intent.

It’s generally not a good idea to compare Search terms to Topics because they are calculated differently. (Unless that’s the whole point, like in the “apple” example!)
There Are Four Filters to Refine Results
You can segment any trend using four filters to get more granular insights.
Location: Worldwide, by country, and sometimes by state or province.
Timeframe: From the past four hours all the way back to 2004.
Category: Hundreds of categories to help you narrow your results.3
Surface: Searches on Google, Google Images, Google News, and YouTube
Eight Ways I Use Google Trends
Now that you have a basic understanding of Google Trends, let’s look at some examples! Here are eight specific ways that I use Google Trends to conduct research. As you read through them, consider how each tactic can apply to your own business or projects and give it a go!
1. Find trends to hijack by looking at real-time data.
Using the Google Trends “Trending Now” page, I can see what searches are trending in a specific region. The list, which includes the biggest trends in the past week, can be sorted by region, category, trend recency, and whether or not the trend is still active.
When I looked at the page on Sunday, December 15, 2024, I saw that “yellowstone season finale” was trending and discovered that the season finale was airing that night. If I wanted to have some topical social media content ready for Sunday night or Monday morning, I could watch the seasonal finale live and be one of the first to turn notable moments into memes related to my niche.

2. Determine if a topic is trending up or down before investing in it.
It’s so much easier to capture existing demand than to try and generate new demand. When a niche or topic grows, the pie gets bigger, and it is easier for you to carve off your own slice of it. When, instead, a niche or topic declines, everyone fights for a piece of a shrinking pie.
That’s why I used Google Trends to identify which health and wellness trends are growing and which are declining.

One trend I identified is that Crossfit has been declining for years. Starting a Crossfit business now would be harder than ever because fewer people are looking for it. On the other hand, Hyrox has been growing quickly, and it’s only a matter of time before interest surpasses Crossfit. Starting a business around Hyrox would come with growing demand and increasing opportunity.

3. Identify seasonal patterns for a specific topic.
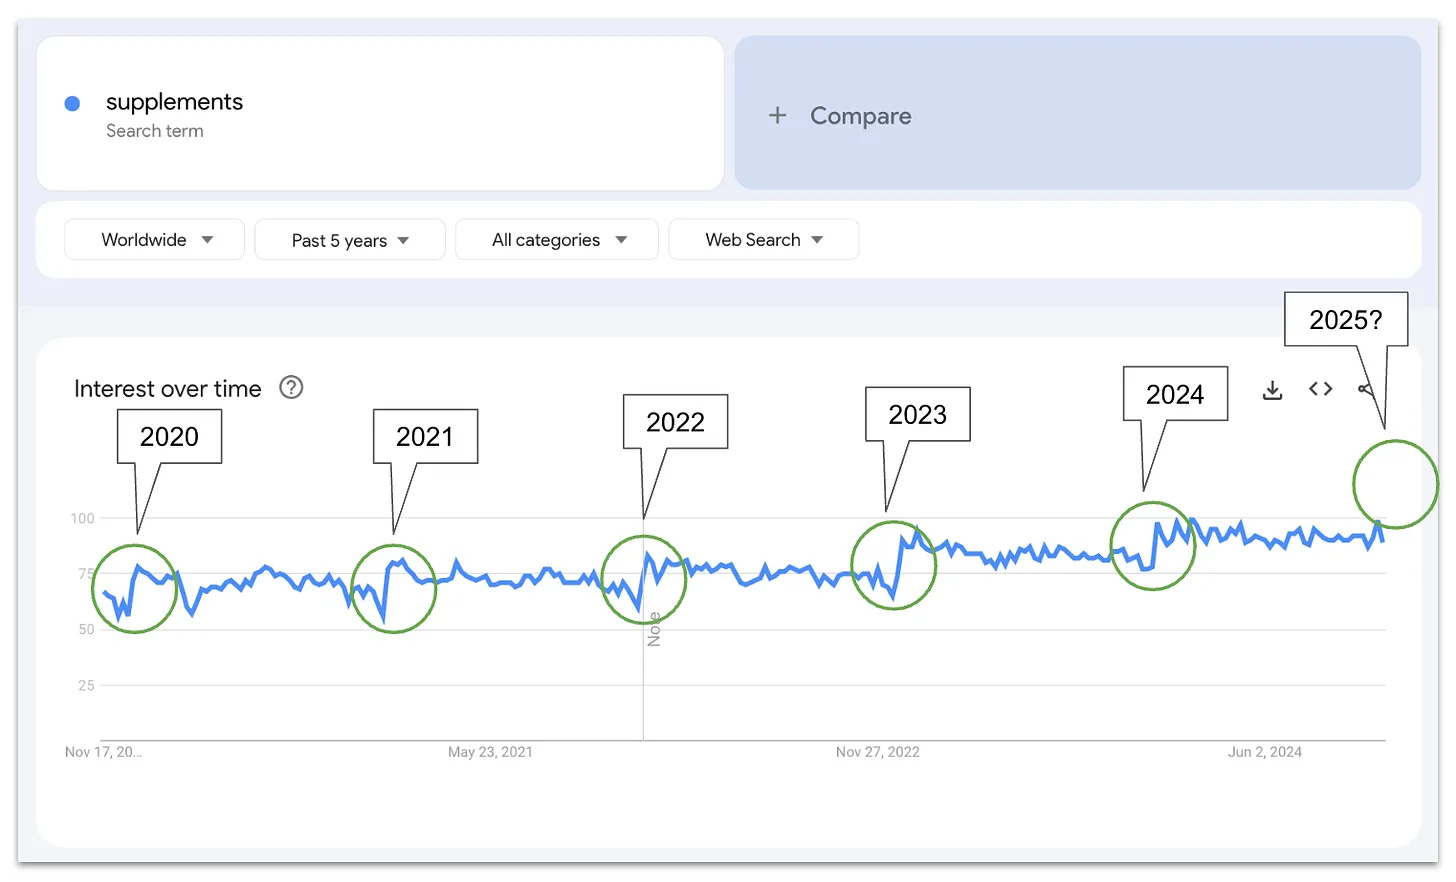
It’s not just important to look at which trends are increasing or decreasing; it’s also important to look for seasonal patterns within a trend. This can help you understand how demand ebbs and flows throughout the year and find opportunities to lean into natural increases.
Not only is the supplements industry growing overall, but it also experiences a seasonal increase at the end of each year. This means the new year is a great time to increase marketing or launch a new supplements business and tap into this expected increase in demand.
4. Find breakout trends related to a topic.
Some of the best insights can be found by looking at the breakout trends related to a topic. These are related terms that experience double and sometimes even triple-digit growth. They can help you find untapped opportunities before everyone else does.
If I created content about generative AI, I could look at the breakout trends related to ChatGPT for content ideas. For example, a tool called Humanize.AI comes up as a breakout trend a few times (with multiple spelling variations).

When I look at the trend, I can see that it’s still growing, so this would be a great topic for me to cover.

5. Compare the relative size of trends.
When you’re prioritizing which topics to pursue (whether a product idea, a marketing campaign idea, or something else), it helps to compare search interest to see the relative size of the opportunity.
If you were planning to start a pet-sitting business in Florida and you weren’t sure if you wanted to focus on cats or dogs, you could begin by comparing search interest. Since there is higher search interest for dog walking, you could start by building out that service offer and associated marketing first and then move on to cat-sitting next.

6. Compare trends across regions.
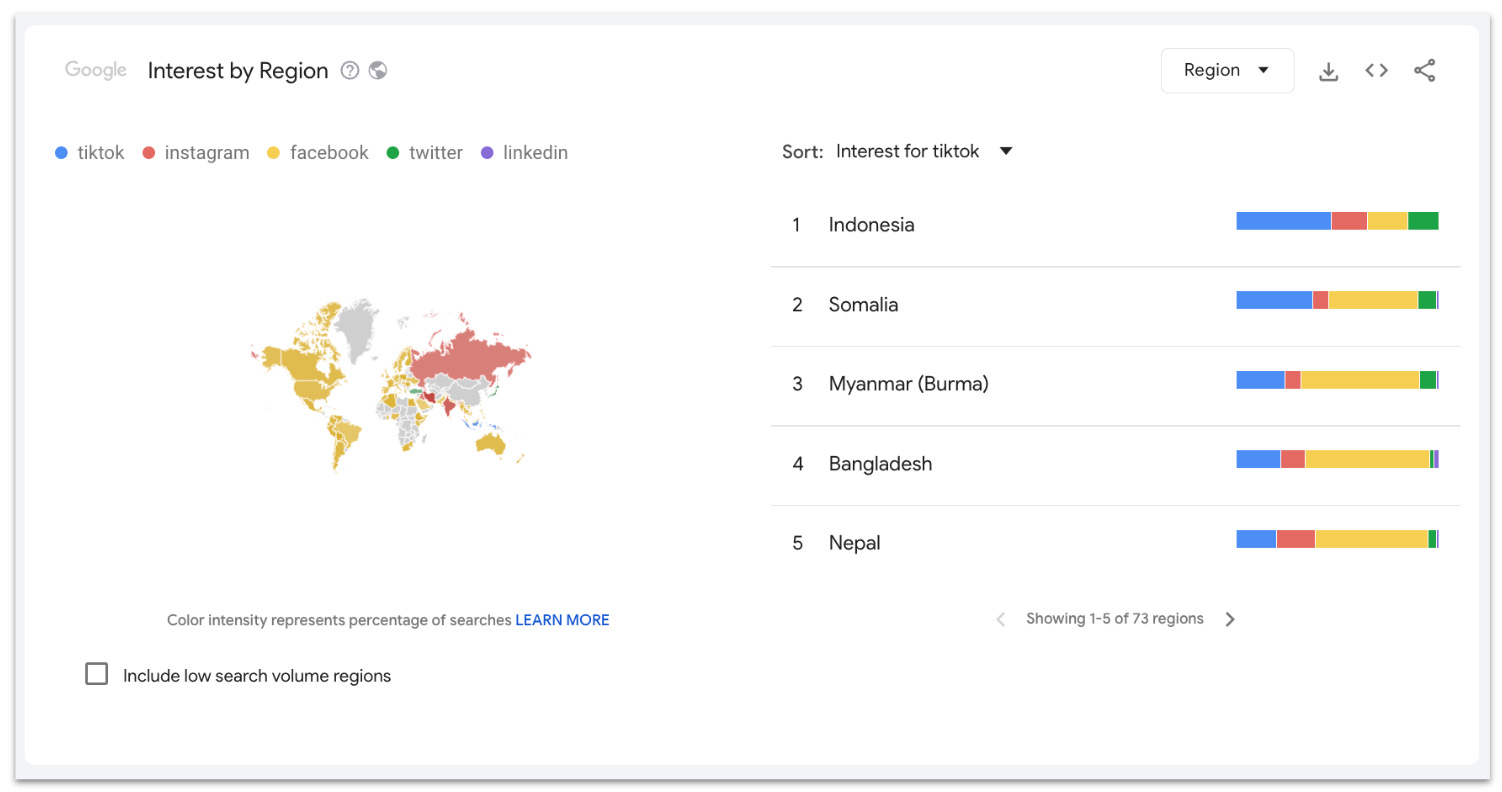
Any search interest data in Google Trends can also be compared across regions. This can be helpful for understanding where a topic is more or less popular and seeing differences in whether trends are increasing or decreasing in different areas.
If you wanted to expand your business into new regions, you would need to build a marketing plan to support that expansion. By comparing the relative interest for different social media networks, you can prioritize which channels will be more important to target in which regions. For example, TikTok is much bigger than Instagram in Indonesia. If I were expanding my business there, I would prioritize making content optimized for TikTok rather than optimizing for Instagram.
7. Compare brand interest.
Brand studies, used to measure brand awareness for companies and their competitors, are expensive and take a while to run. Most big companies can only do them a few times a year, at most. For the rest of the year, and for everyone else who can’t afford to run brand studies, there’s Google Trends.
Share of search, which can be calculated using Google Trends, is a decent proxy for market share.4 Brands that get searched a lot on Google are more likely to have a more substantial market share.
The graphic design industry has gone through a significant shift in the last few years, and the change in which brands lead with the average user is apparent using search interest. Many professional designers loathe Canva but it has more interest than Adobe ever did. Canva can be used by anyone, regardless of design skills, and its rise is evidence that graphic design is becoming democratized.

8. Do competitor research.
If your competitors are big enough to have a presence on Google Trends, it’s a great tool to understand how your search interest compares. You can also analyze nuances like if their interest is growing or declining, and more granular data about where they’re winning and where they’re not (so you can target their weaknesses).
A US airline that wants to gain market share could start by looking at how its search interest compares to other airlines at a state-by-state level. For example, while Jetblue has a strong share of search interest in Massachusetts, Connecticut, and New York, it falls behind Southwest in New Hampshire and Rhode Island. Knowing this, Jetblue could focus its top-of-funnel marketing in those states on features that differentiate it from Southwest.

By now, you should be getting comfortable with Google Trends and how to use it. But don’t just stick to this list! The sky is the limit with practical applications for Google Trends data. I’ve barely scratched the surface of what’s possible, so let me know if you want more advanced content about Google Trends, too.
To endless possibilities,
Casandra
PS. If you found this useful, please tap the ❤️ below. It helps me out a lot!