


Did you know that people who click a link in your post but aren't subscribed to your publication don't count toward your click-through rate?
Or that your open rate includes app opens, not just email opens?
Substack's post stats are more nuanced than they look, and if you're reading them without understanding how they're calculated, you might be drawing the wrong conclusions.
This guide breaks down every metric on your post stats page in plain language, along with how to actually use each one.
What Are Substack Post Stats?
Substack post stats are the data Substack tracks for each post you publish, showing you how your audience found, opened, and engaged with it.
What sets them apart from most publishing platforms is that every Substack post is both an email and a web page simultaneously. That means your stats are capturing two different audiences: subscribers who received it in their inbox or app, and web visitors who found it through search, social, or a referral link. Understanding which audience each metric reflects changes how you interpret your numbers and the decisions you make based on them, whether that’s figuring out what content is working, understanding your true reach, or pitching sponsorships.
How to Access Substack Post Stats
Each post you’ve published has its own metrics page showing its performance.
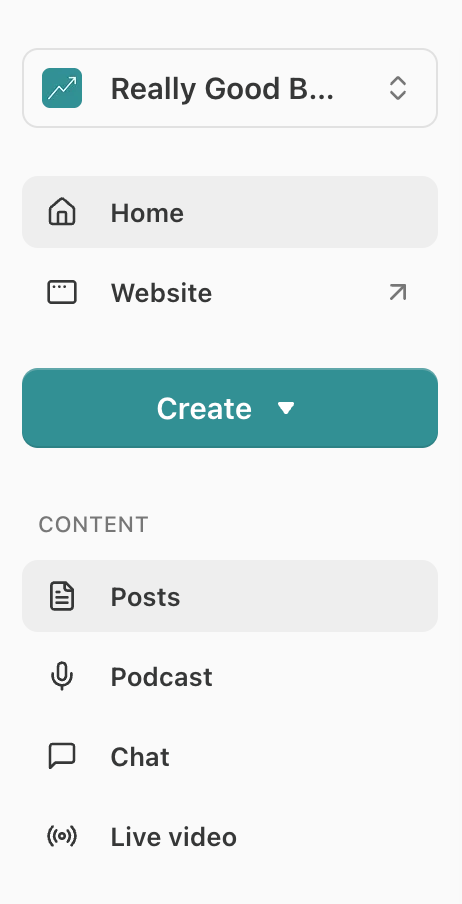
To access your Substack post metrics, navigate to the “Posts” tab in your publication’s dashboard.
Then, click on the post you want to explore performance for.
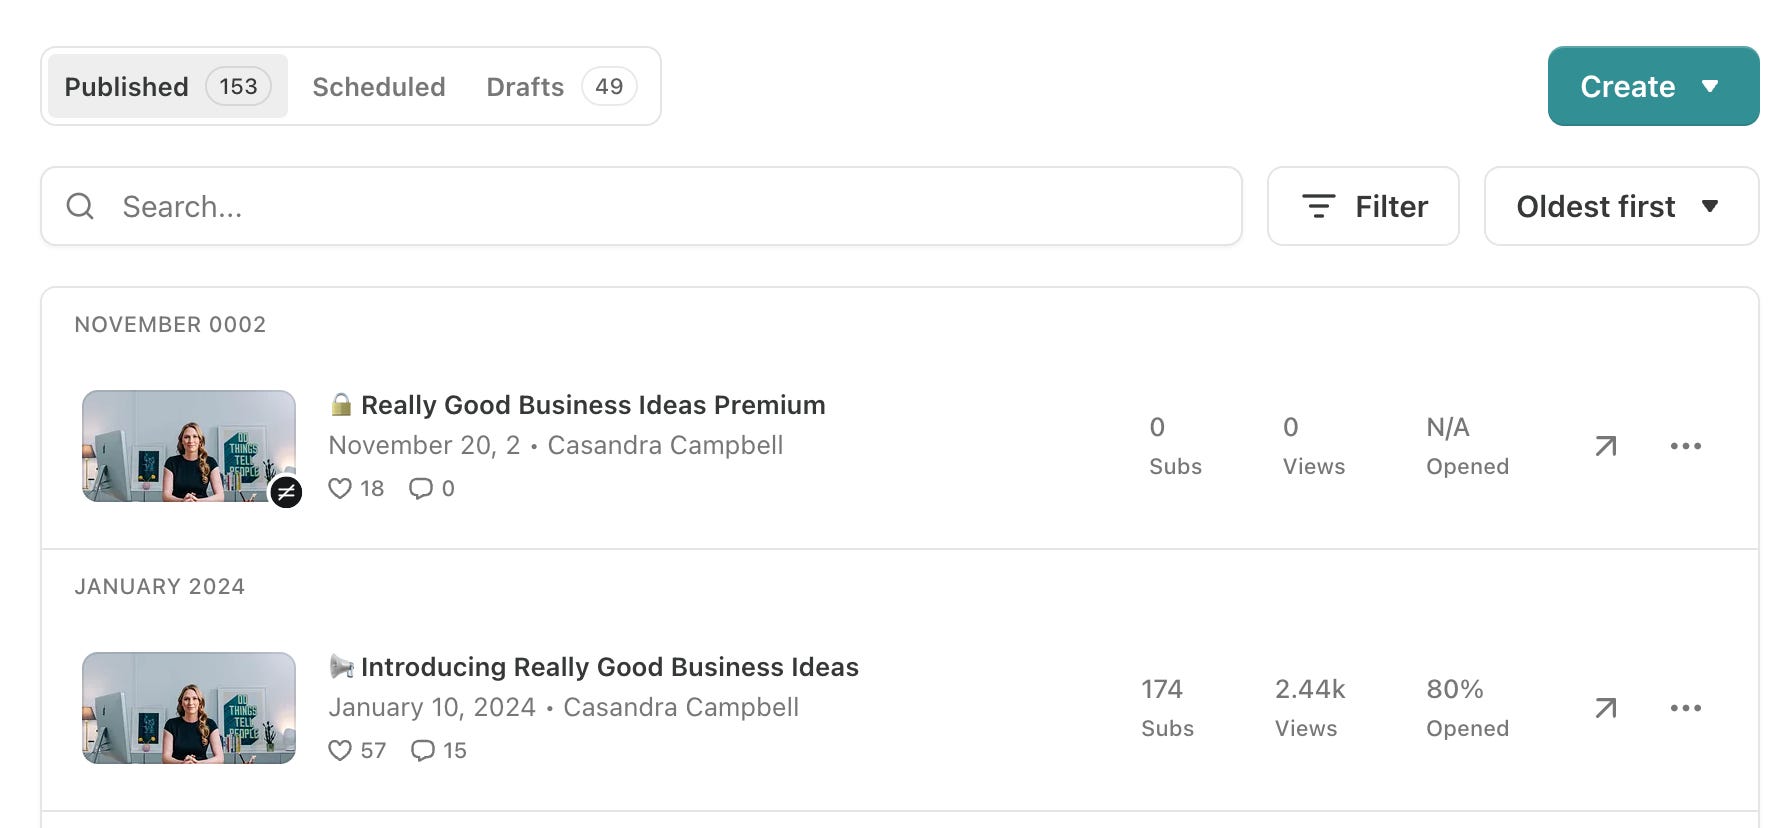
You'll land on the post performance page, which has five tabs: Overview, Reach, Engagement, Growth, and Discussion.
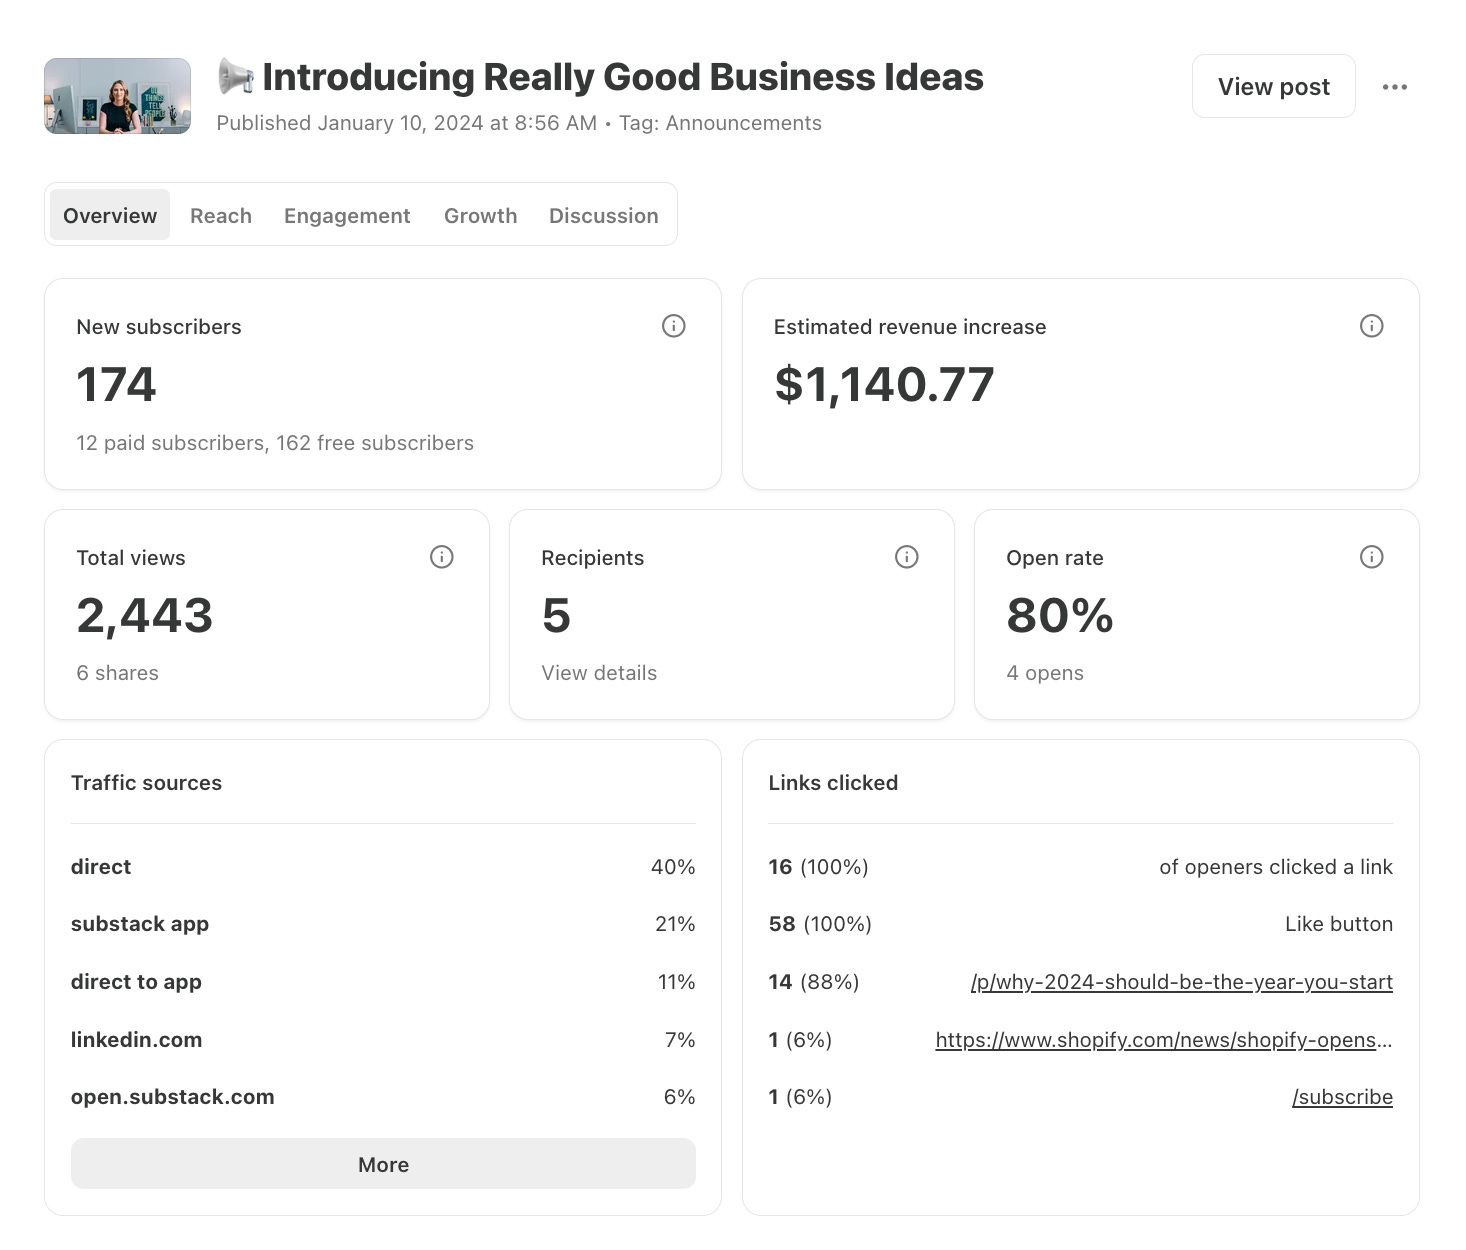
Let’s go over each tab of the post performance page in detail.
Each Substack Post Metric Explained
Below is a breakdown of every metric across all five tabs, what each one means, how it’s calculated, and how to actually use it.
Overview
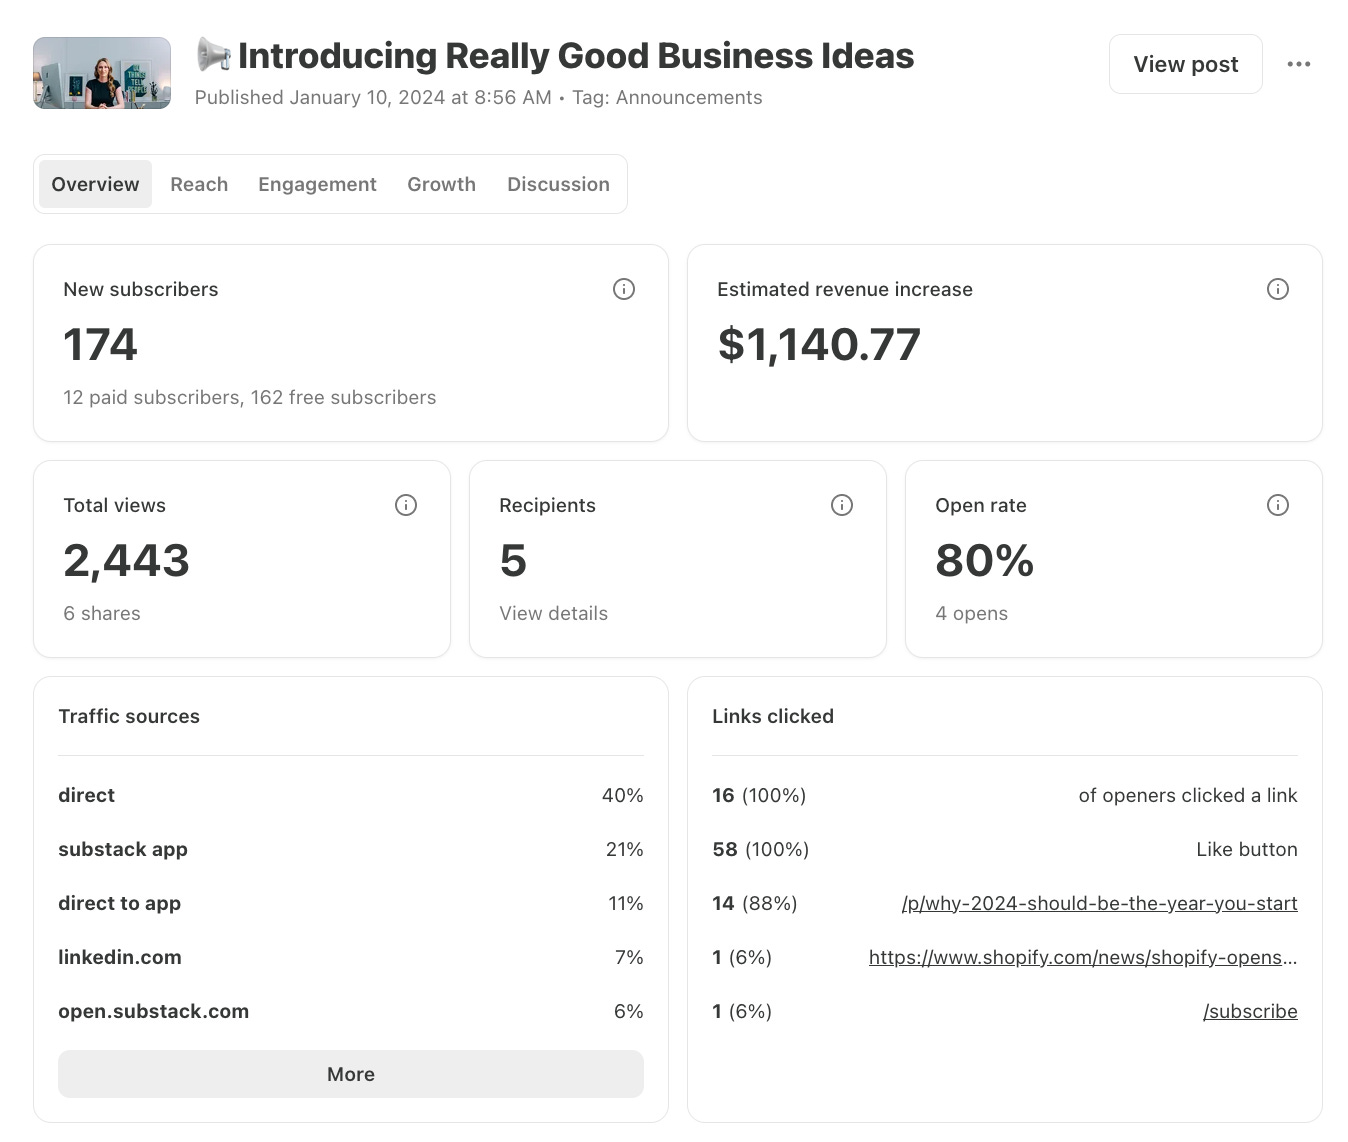
The Overview tab pulls together key metrics from the Reach, Engagement, and Growth tabs into a single place for a quick summary of how a post performed. We’ll cover each metric in detail in the relevant tab below.
Reach
The Reach tab includes four metrics to help you understand your post’s reach: Recipients, Delivery rate, Views, and Traffic.
Recipients
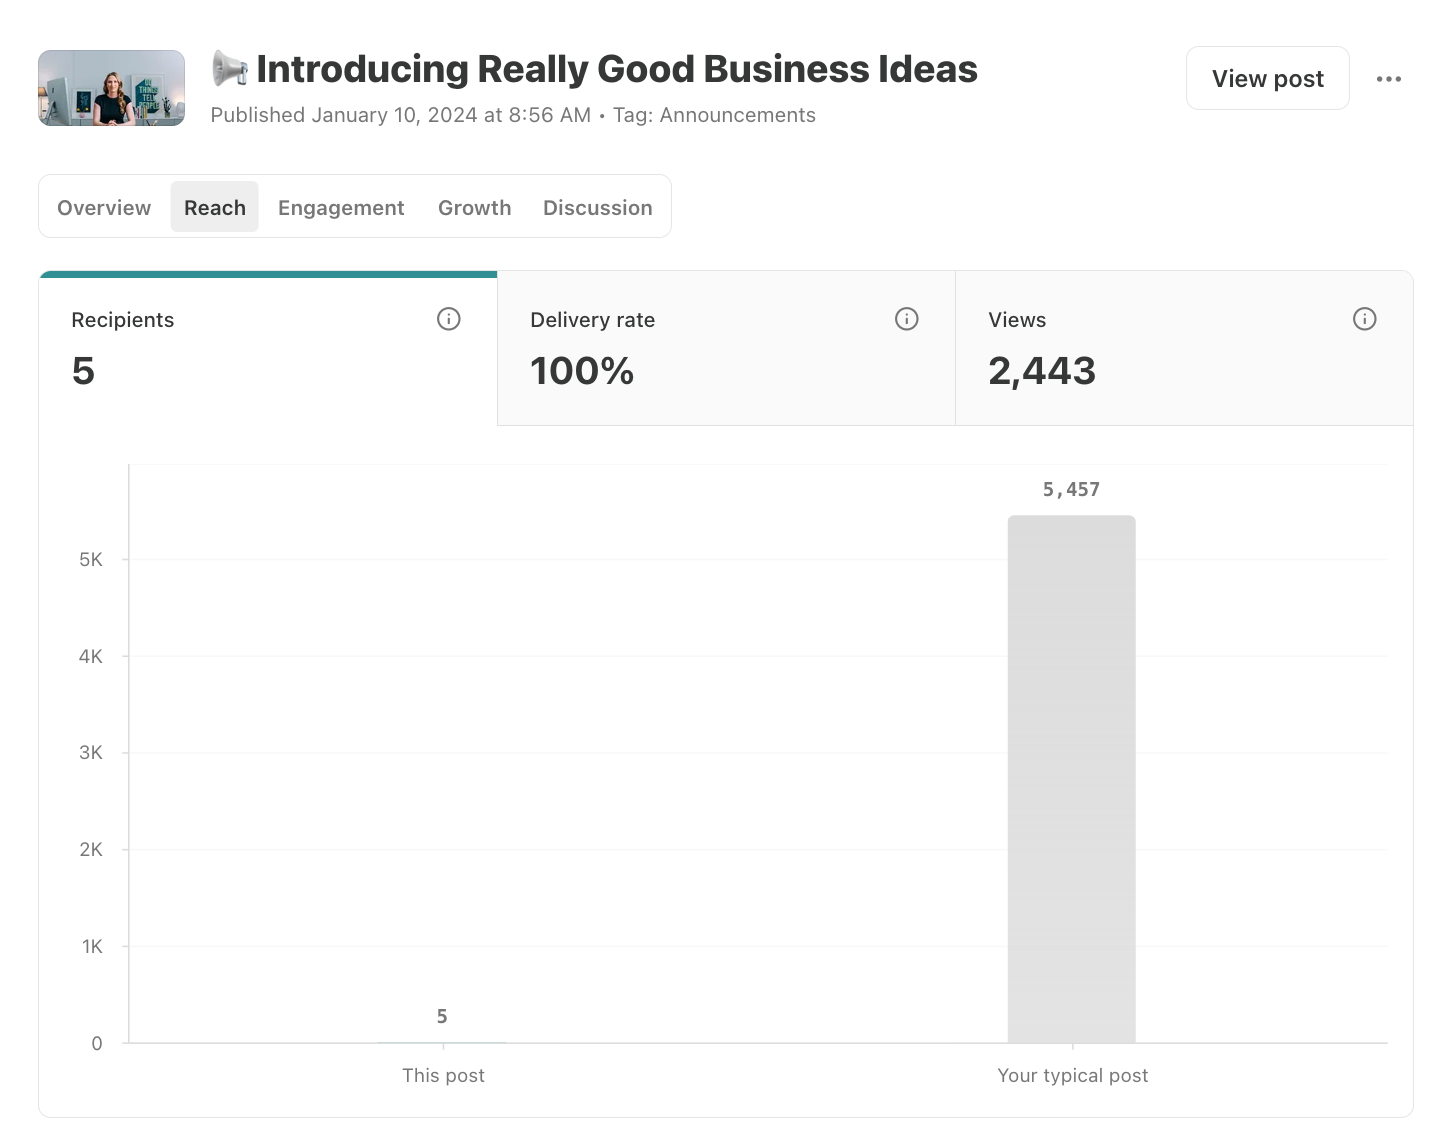
What It Means: Recipients is the number of subscribers who were sent your post either by email or through the Substack app. If a subscriber receives it in both places, they are only counted once. This number may be smaller than your total subscriber count if you’ve segmented a post to a specific audience, like subscribers to a specific publication section or paid subscribers only.
How to Use It: Recipients is more useful as context for other metrics than something to monitor on its own. It gives you a sense of the audience size behind each post and its opportunity for reach and engagement.
Delivery Rate
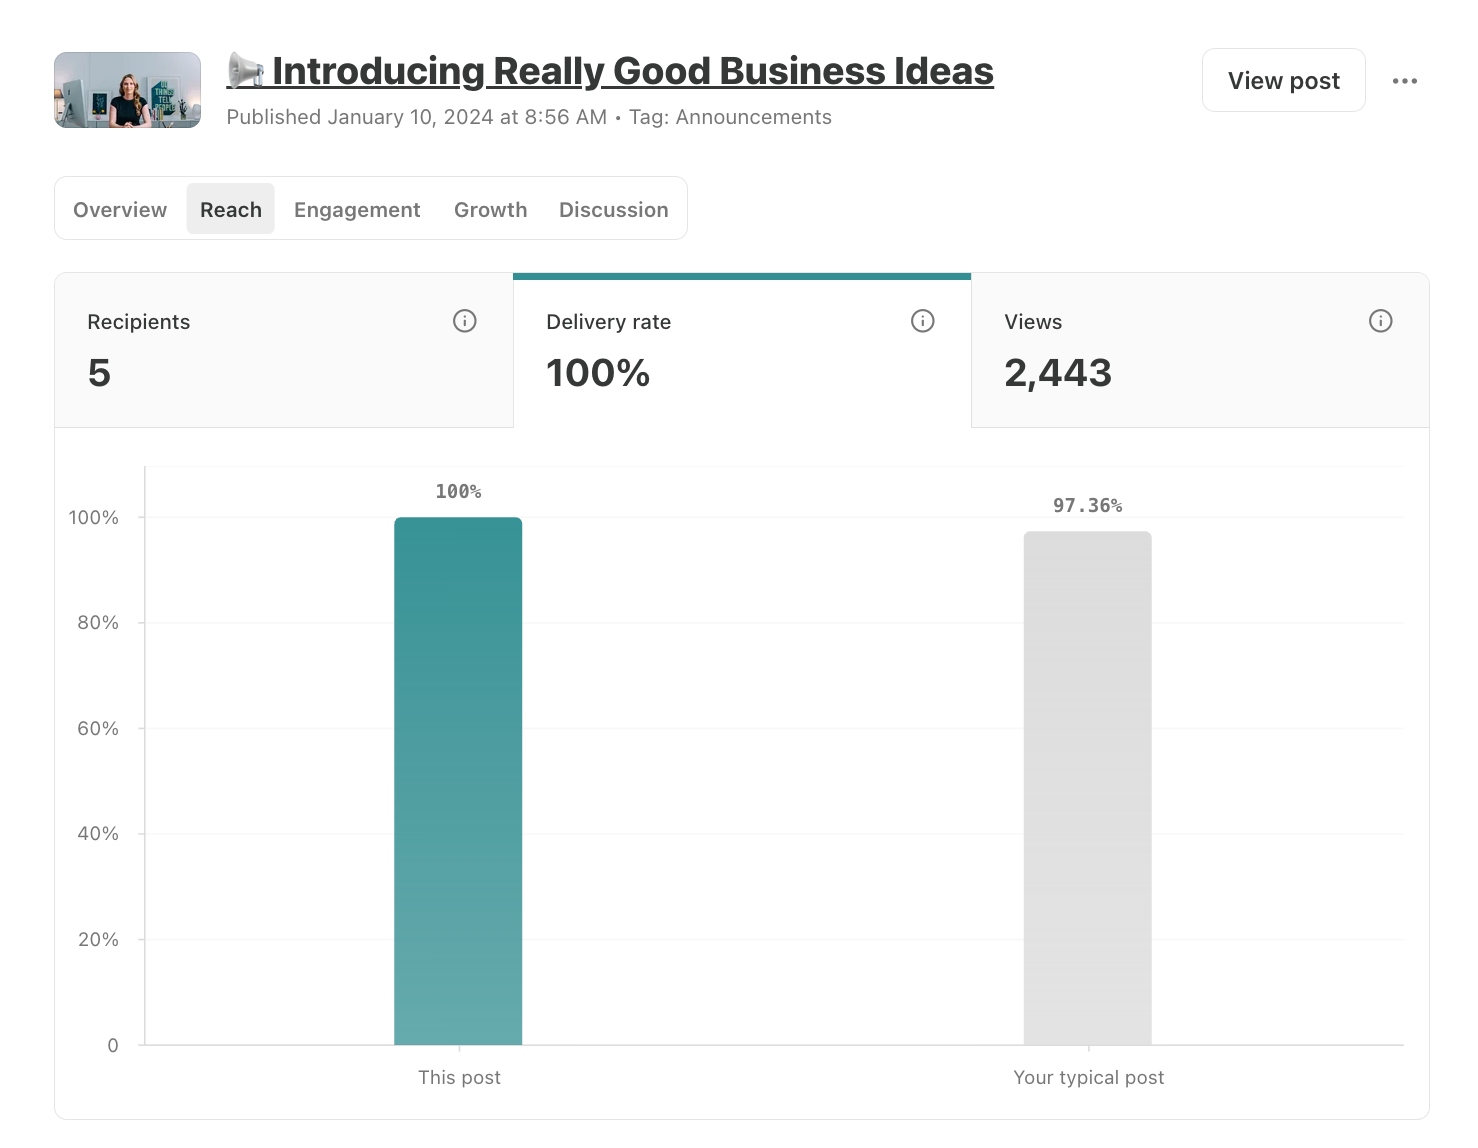
What It Means: Delivery rate is the percentage of subscribers who successfully received your post by email or through the Substack app.
How to Use It: One of the benefits of Substack is that they maintain a strong sender reputation on your behalf. Most Substack publications will have a consistently high delivery rate (95%+) and won’t need to think much about this. If yours is consistently lower, it may indicate a publication-specific email deliverability problem that requires investigation.
Views
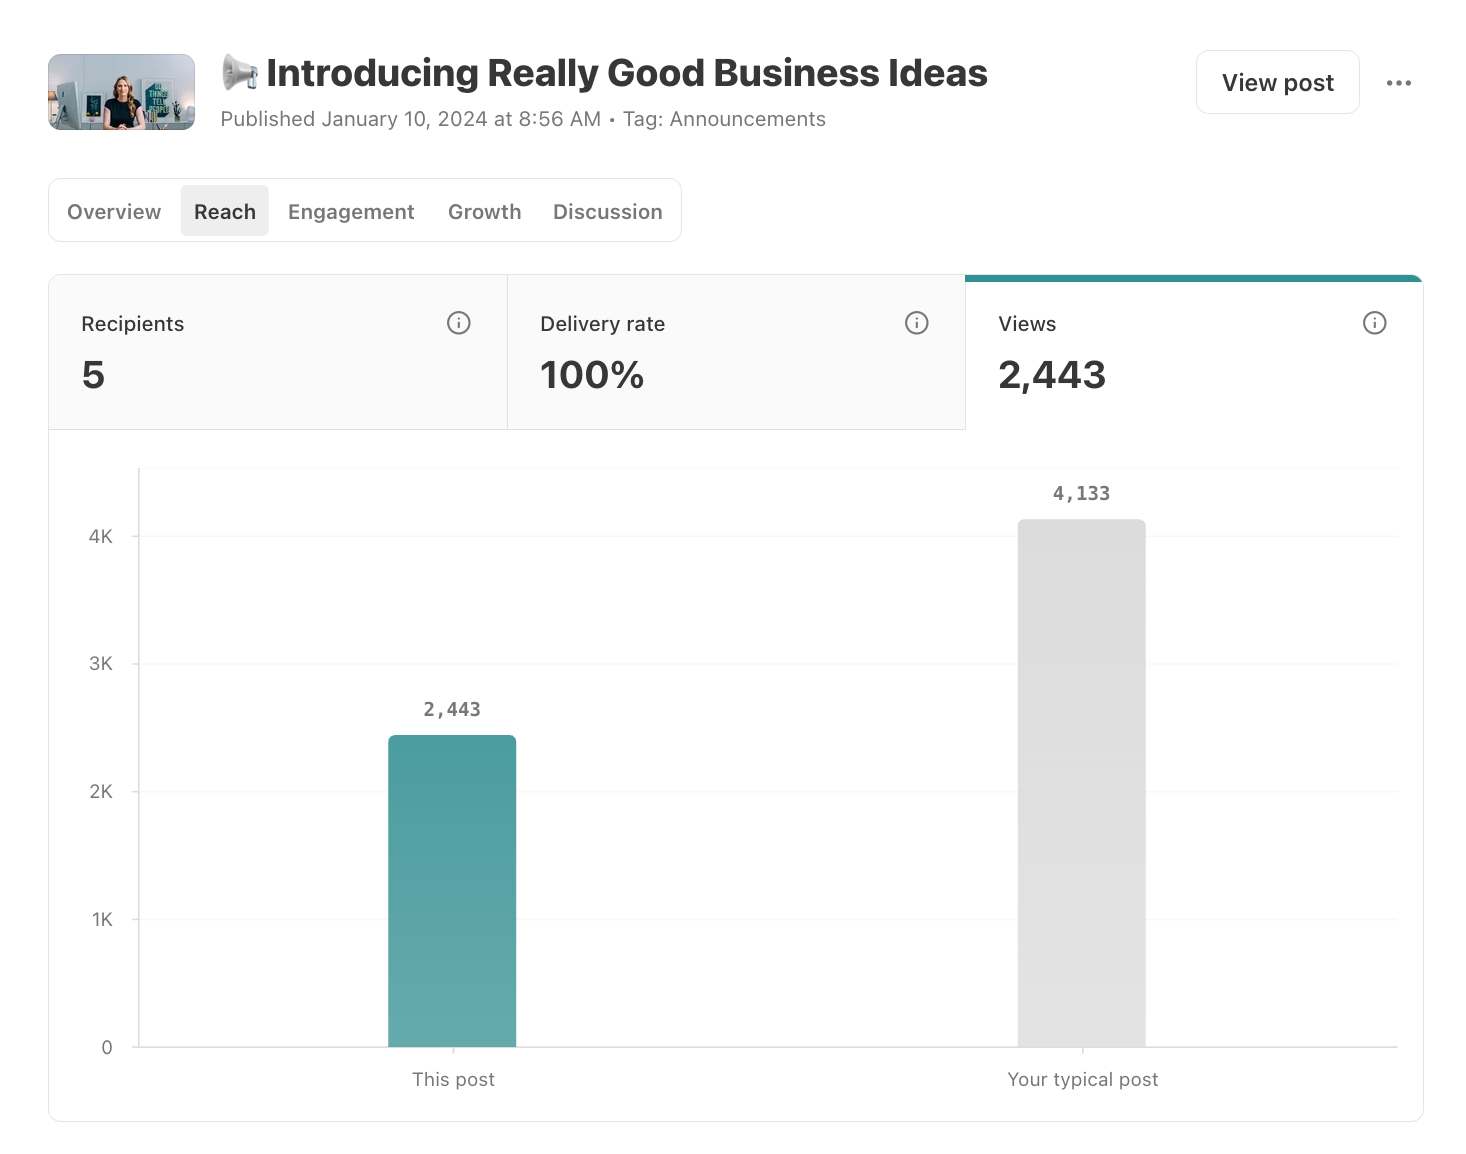
What It Means: Views is the total number of times a post was viewed across the web, email, and the Substack app. If one person views it five times, that counts as five views.
How to Use It: Comparing Views across posts can be interesting, though keep in mind that your typical post average will increase as your list grows, which limits how useful that comparison becomes over time. Comparing views to recipients on a given post is more telling. A post where views significantly exceed recipients got meaningful traffic from outside your subscriber list.
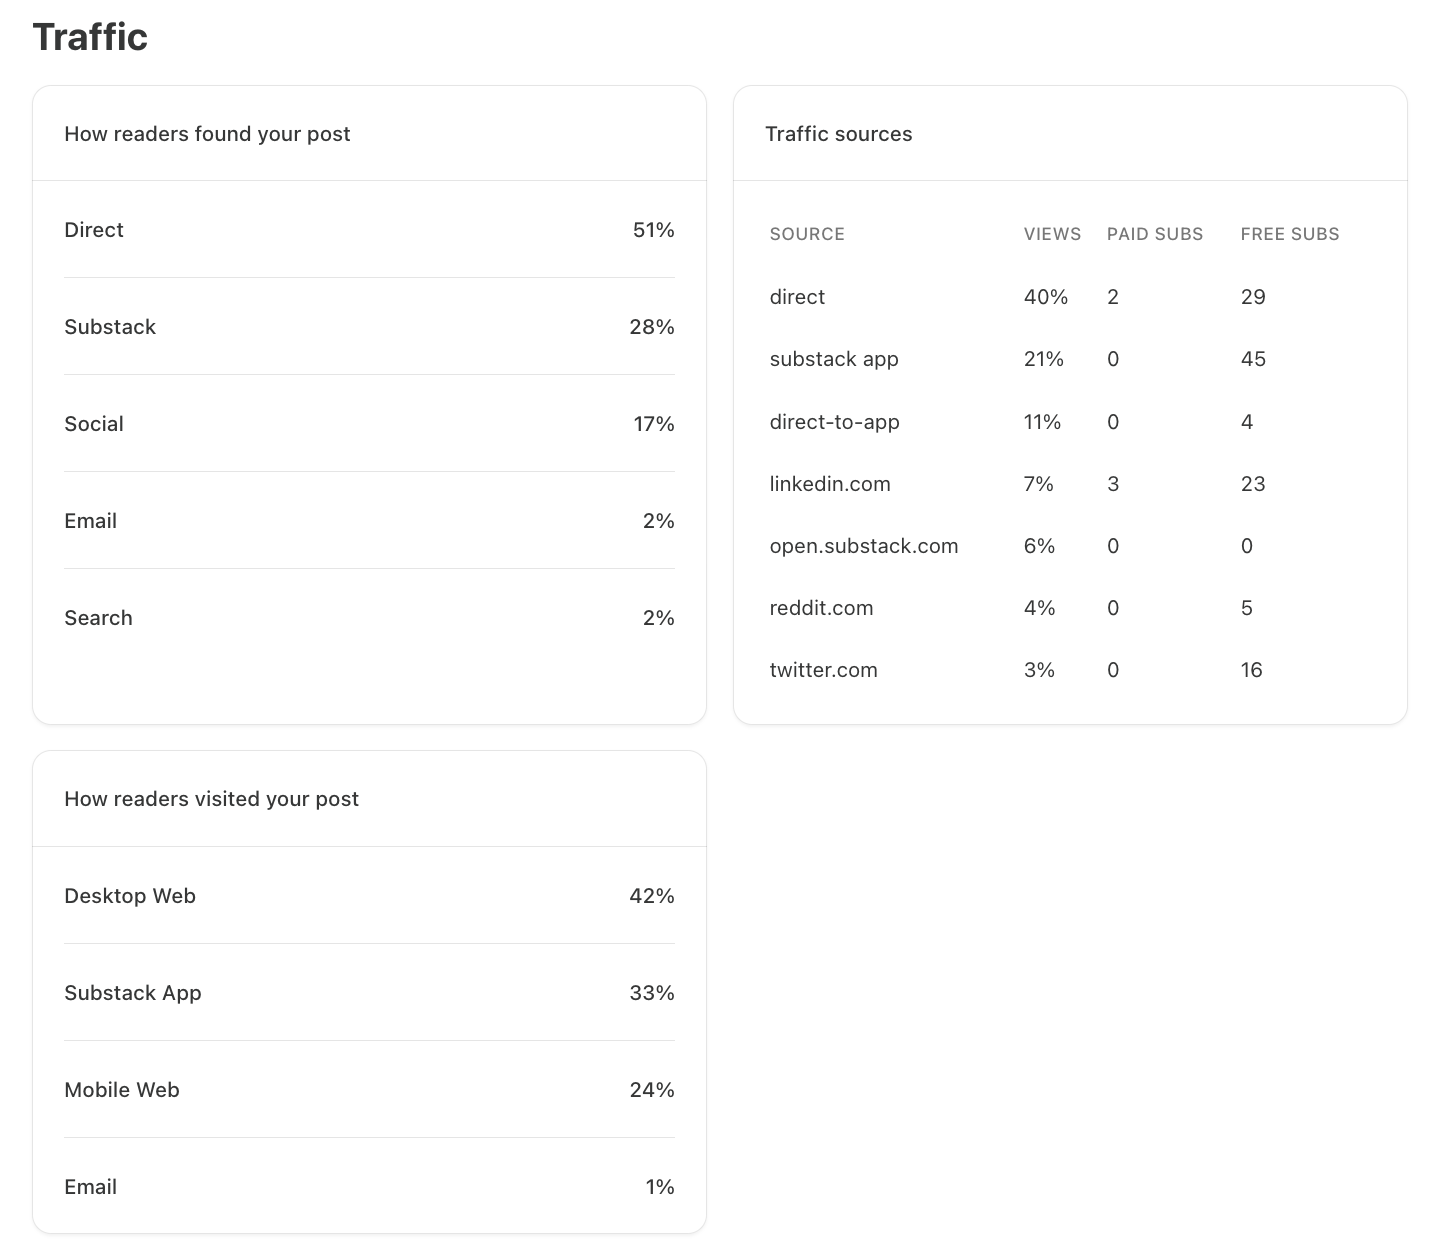
What It Means: The Traffic section breaks down how readers found and accessed your post.
How readers found your post shows the percentage of people who viewed it via each broad referral category, such as Email, Social, or Substack.
Traffic sources the view percentage and the number of subscribers acquired via specific sources in each category, such as LinkedIn, Twitter, and Reddit for Social.
How readers visited your post shows the percentage of people who viewed your post by platform: email, desktop, mobile, or the Substack app.
How to Use It: For most posts, this breakdown will look similar in the short term after publishing. Most of your traffic will come from email, which won't tell you much you don't already know. Where it gets more interesting is checking back on older posts to see how traffic has shifted over time as search, social shares, and other referrals kick in. Personally, I don’t typically bother. If you want a deeper understanding of your traffic, Google Analytics is a much better tool.
Engagement
The Engagement tab includes four metrics to help you understand your post’s engagement: Engagement rate, Open rate, Click-through rate, and Engagement.
Engagement Rate
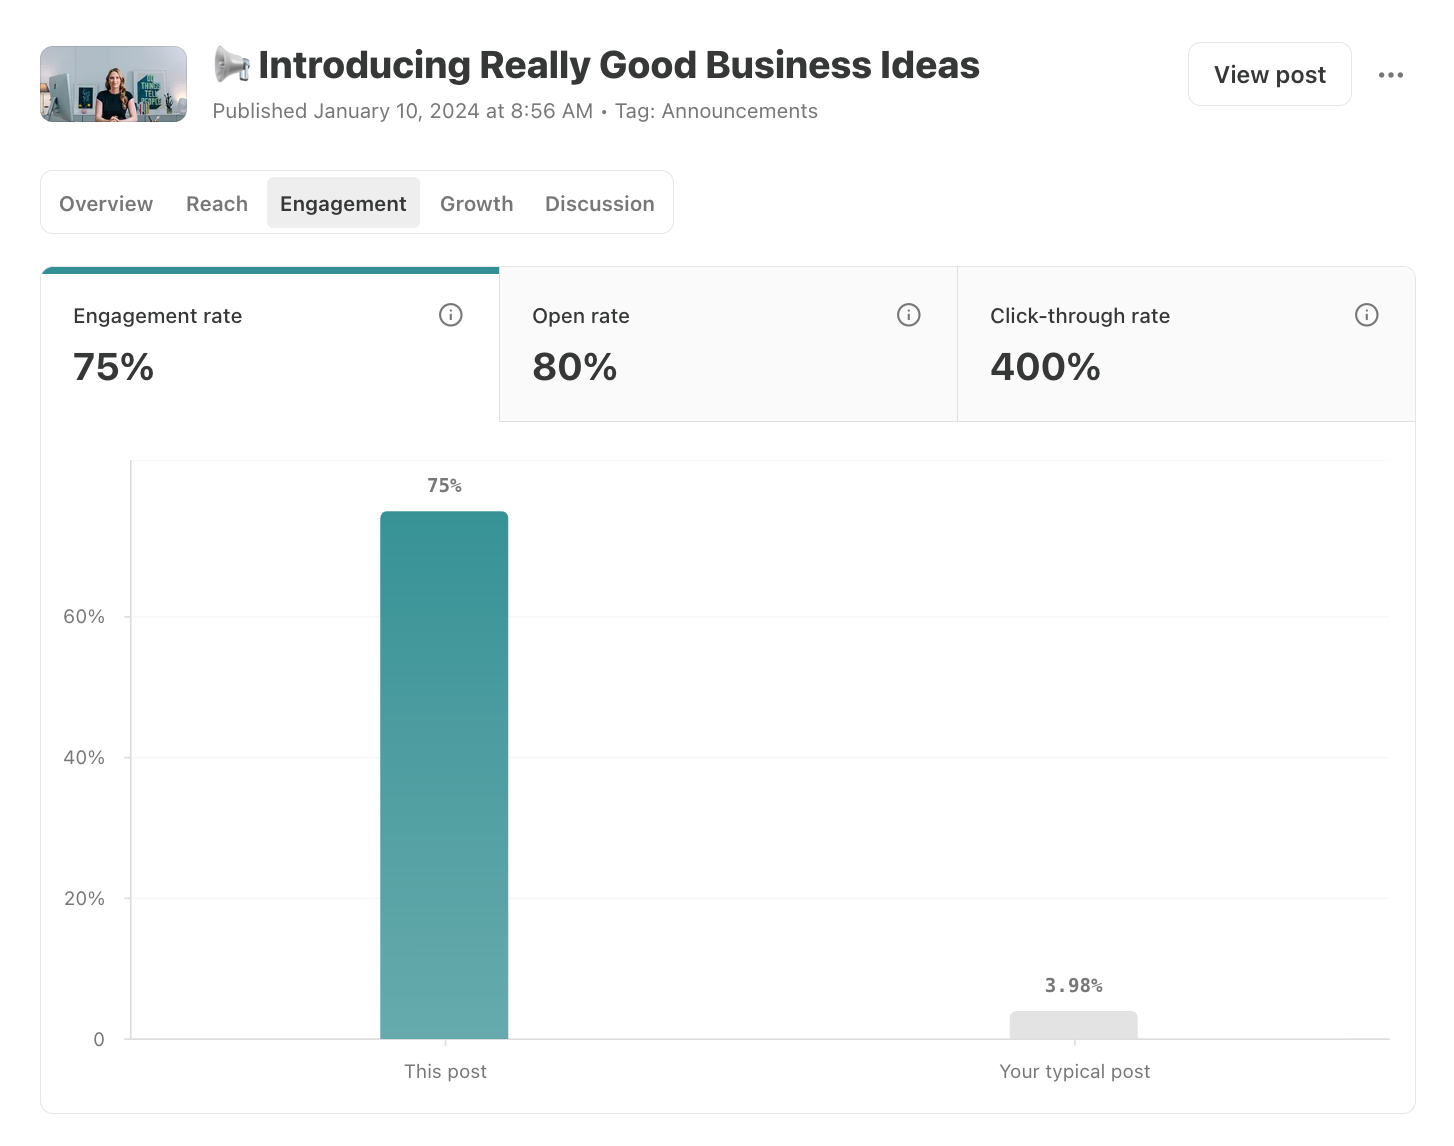
What It Means: Engagement rate is the percentage of subscribers who engaged with the post after opening it by email or Substack app notification. Engagements include liking, clicking a link, sharing or restacking, commenting, reading to the bottom, or watching and listening to media for at least 30 seconds. A subscriber who does multiple things is only counted once. Notably, non-subscribers who engage with your post are not included here.
How to Use It: Engagement rate goes beyond opens to whether readers actually did something with your post. Higher engagement posts tend to get broader reach through network effects, so when a post performs above your average, it’s worth asking why and trying to replicate it. A lower engagement rate isn’t necessarily a problem, as some topics naturally draw more interaction than others.
Open Rate
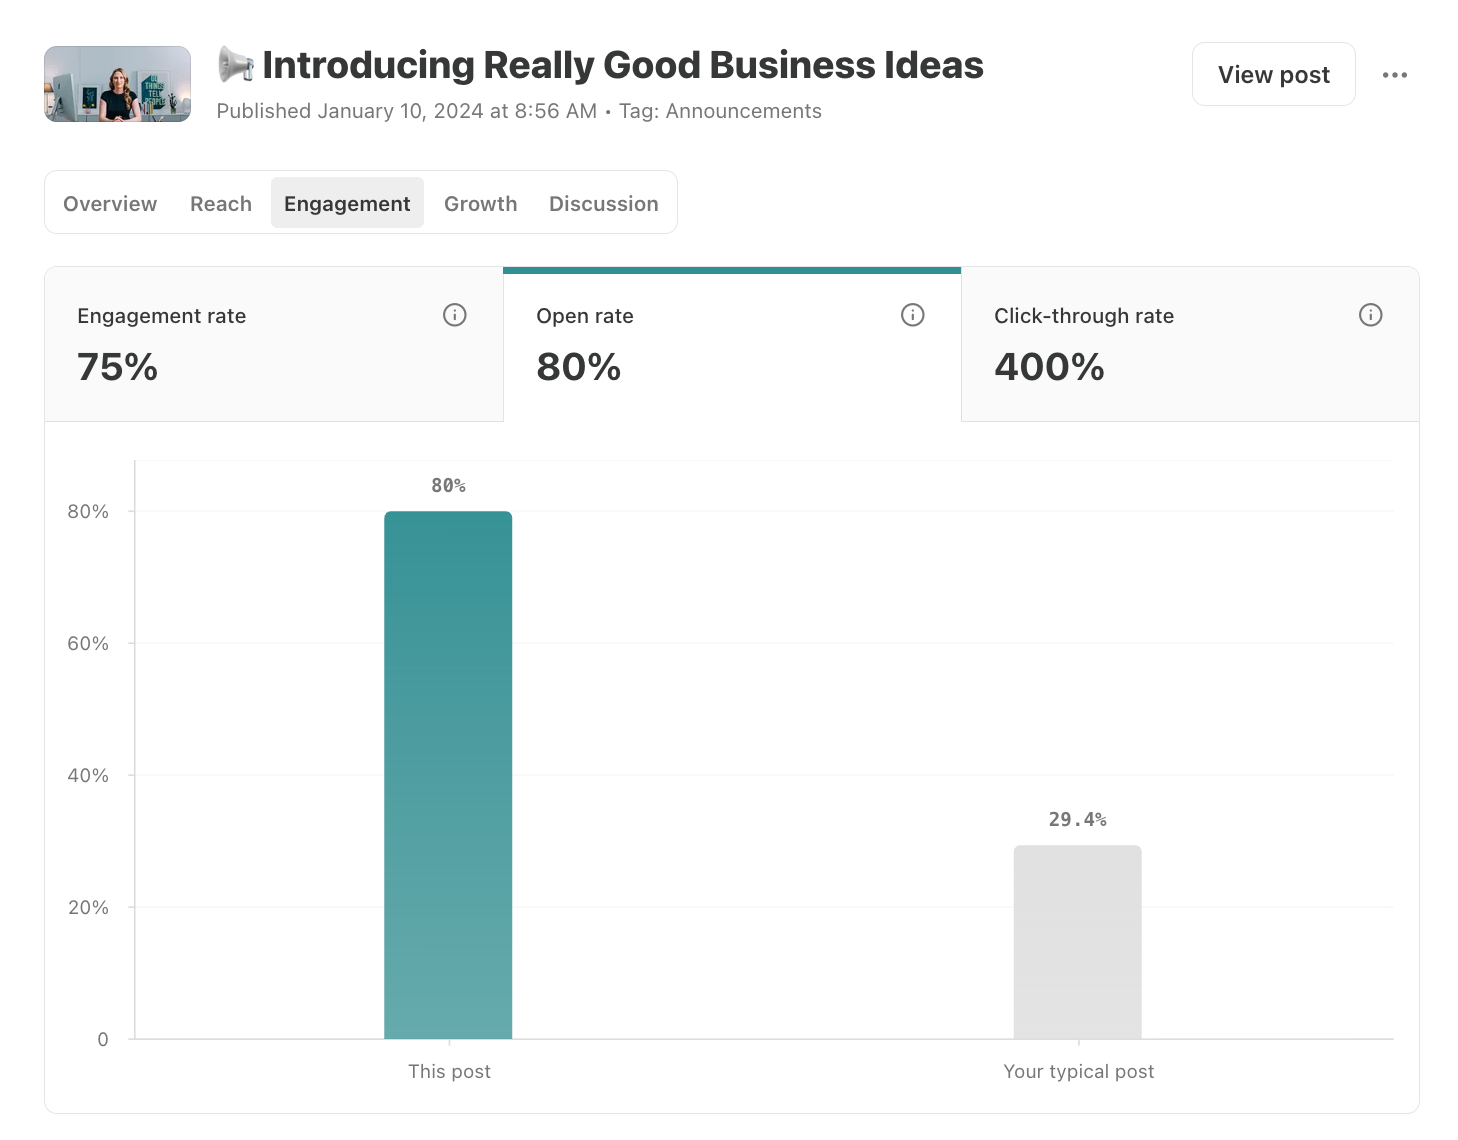
What It Means: Open rate is the percentage of recipients who opened your post. If one person opens it multiple times, they are only counted once.
How to Use It: Open rate is a reflection of how well your subject line and sender name are working, both of which are a reflection of your content and brand. The numbers aren't perfectly accurate, but the relative comparisons can be useful. Look for trends and outliers rather than obsessing over every post. When a post spikes above or drops well below your average, dig into why. Decline over time is normal as your audience grows beyond your early superfans, so don't read too much into a gradual downward trend.
Click-Through Rate
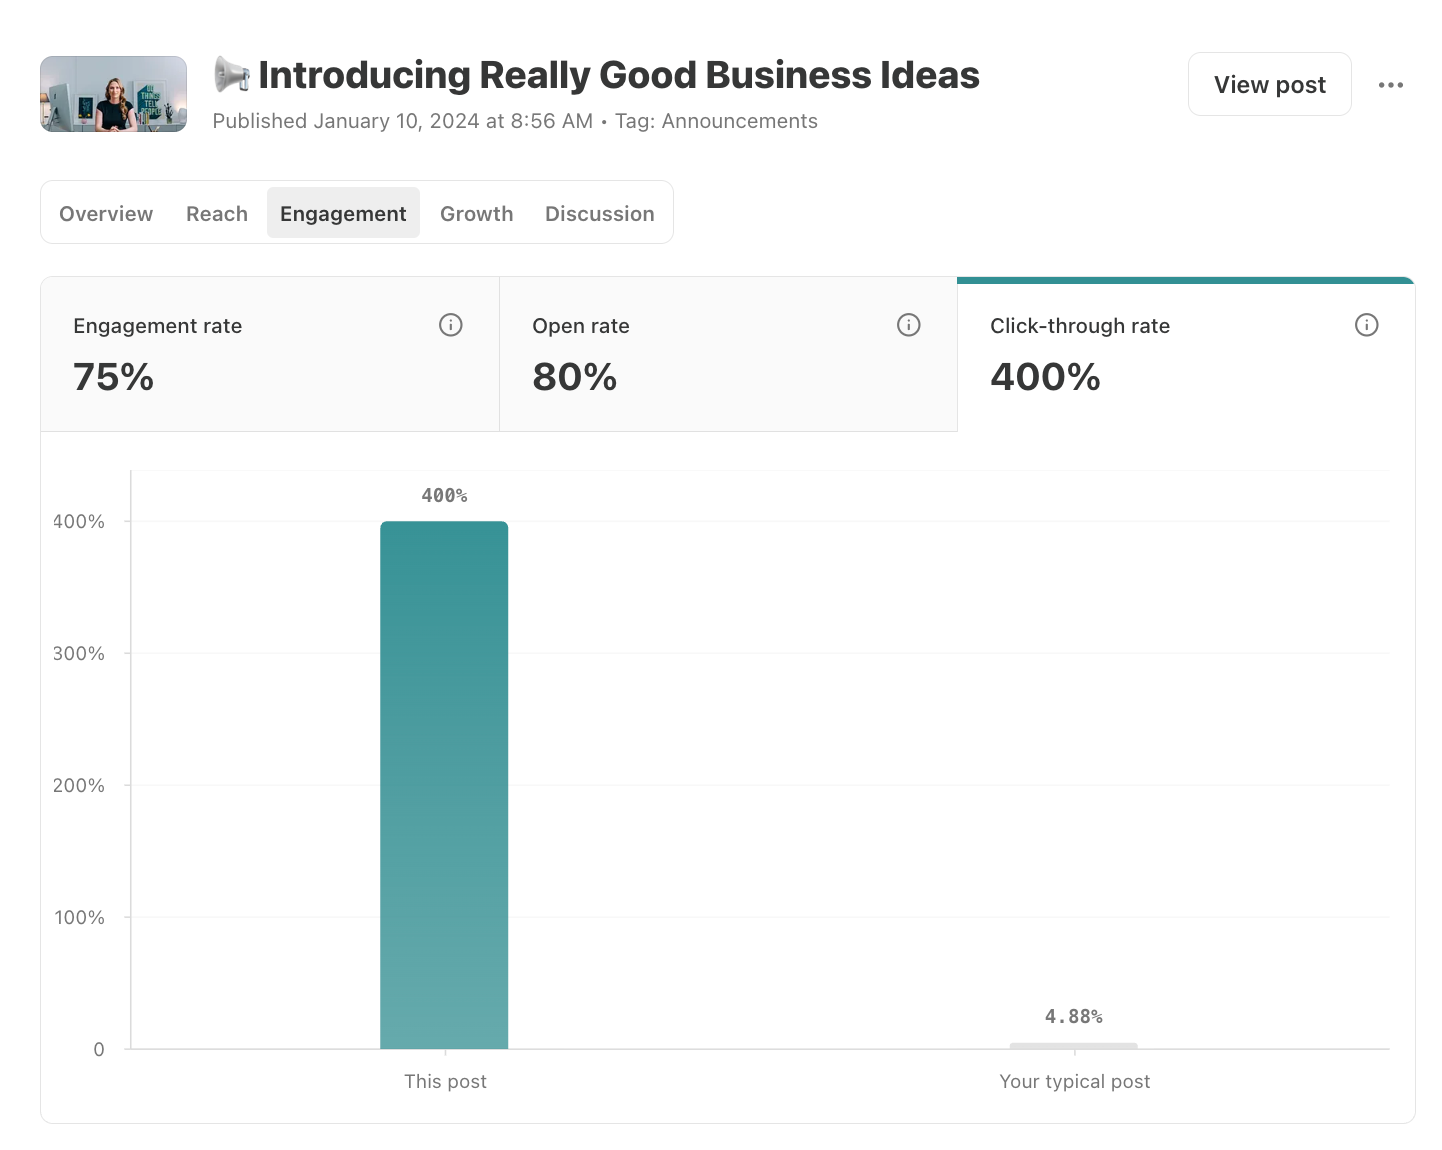
What It Means: Click-through rate is the percentage of openers who clicked at least one link in your post. Non-subscribers who read your post and click links are not included.
How to Use It: Click-through rate is most useful when your posts regularly include links you want readers to follow, such as affiliate links, product recommendations, or calls to action. A higher-than-usual click-through rate on a particular post tells you the offer or link resonated. If you don’t include many links, this metric won’t tell you much.
Engagement
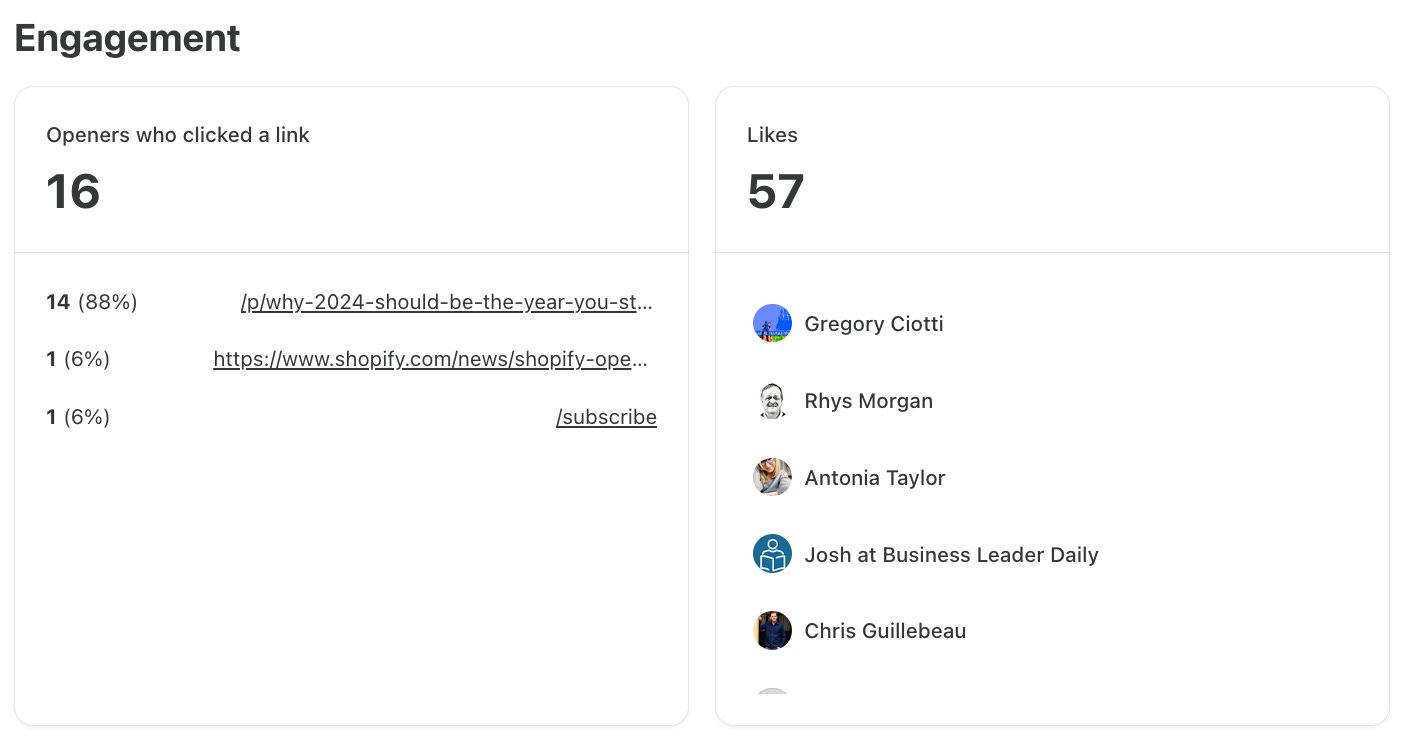
What It Means: The Engagement section shows two things: a breakdown of which links subscribers clicked, how many times a link was clicked, and a list of who liked your post.
How to Use It: I usually try to keep readers on my publications, so this is not a section I check regularly. If your click-through rate is unusually high on a post, coming here to see which specific link drove it can help you understand what resonated. It is also useful when you want to understand how much interest a specific offer generated.
Growth
The Growth tab includes three metrics to help you understand your post’s subscriber and growth contribution: Estimated revenue increase, Paid subscribers, Free subscribers.
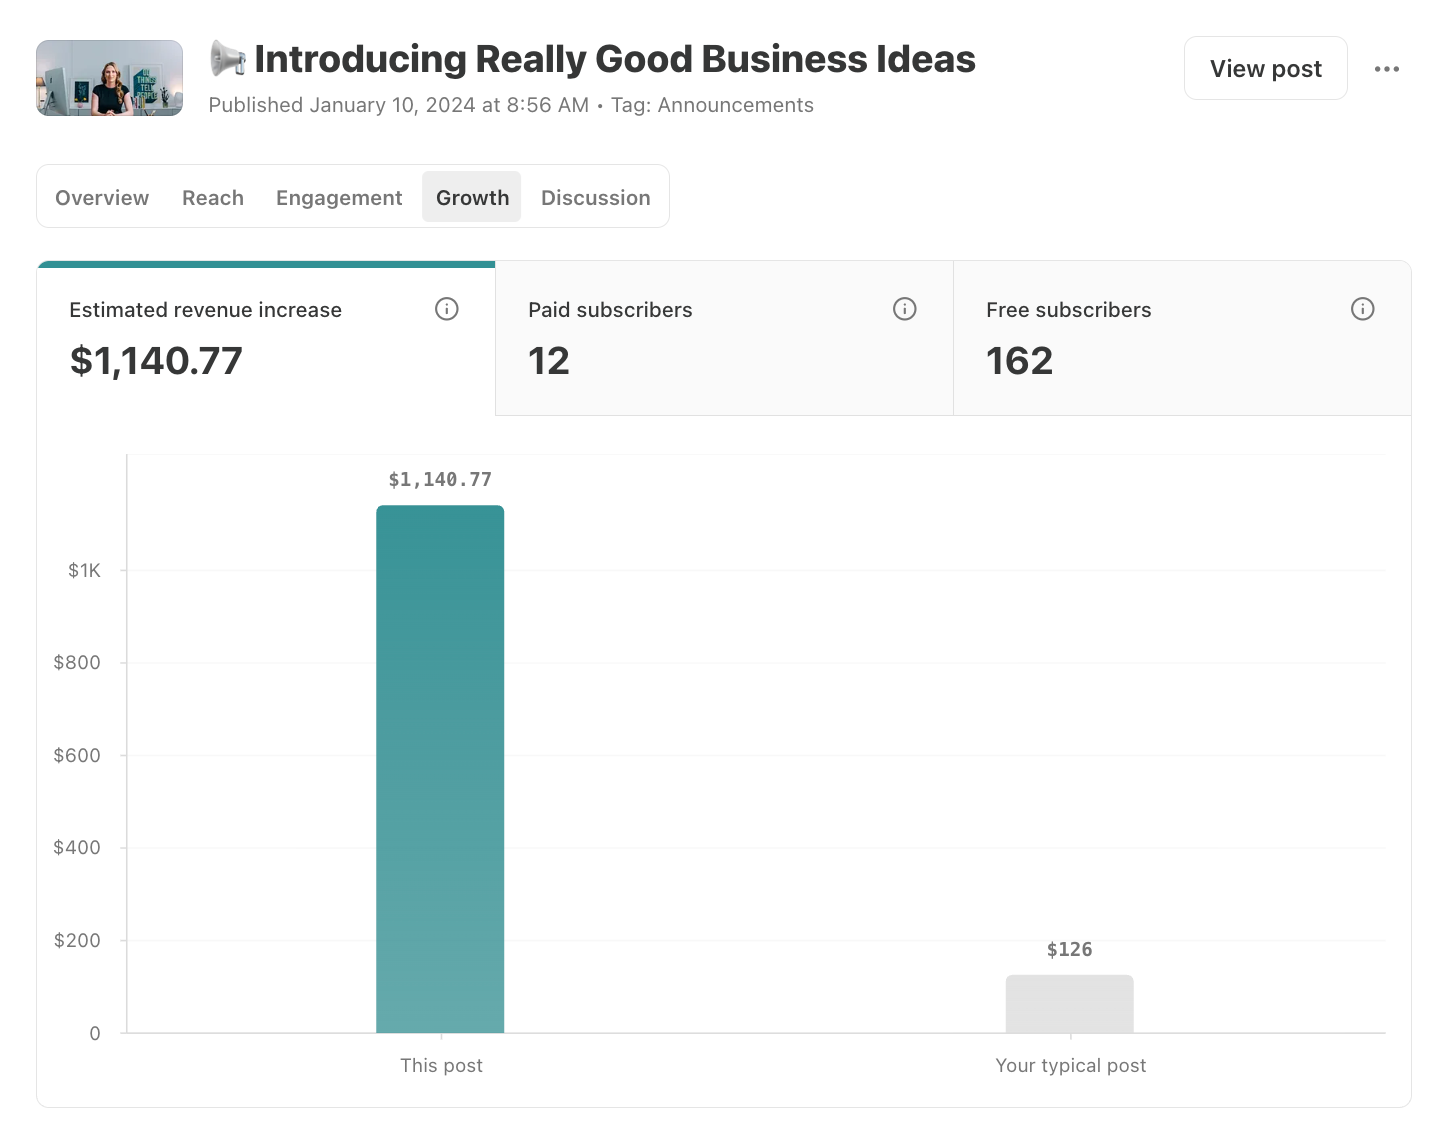
Estimated Revenue Increase
What It Means: Estimated revenue increase is the projected increase to your gross annualized revenue from new paid subscriptions driven by that post. Further down the page, it breaks down by subscription type: annual, monthly, founding, and free trials. Coupons, subscription changes, and payment failures after retries are not factored in, so the actual number may differ.
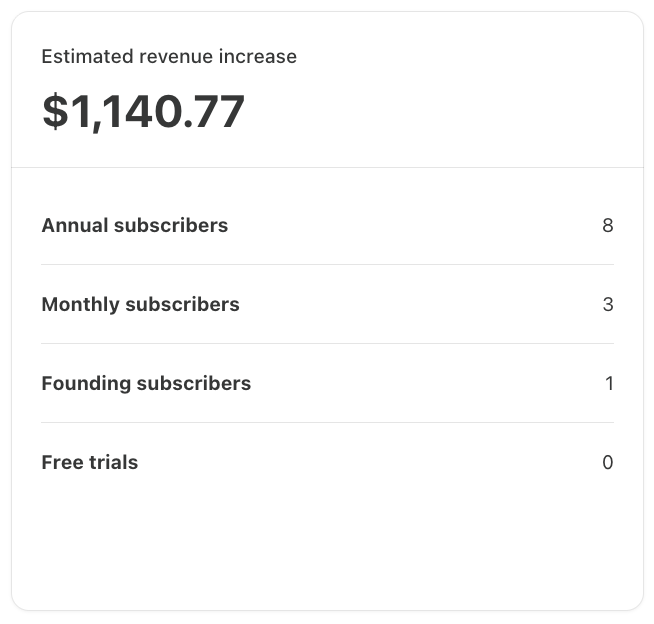
How to Use It: This is one of the most useful metrics on the Growth tab. It helps you identify which posts are actually converting readers to paid subscribers, so you can do more of what works. The posts that drive the most revenue are not always your most popular ones, which makes this metric important to monitor separately from views or engagement.
Paid Subscribers
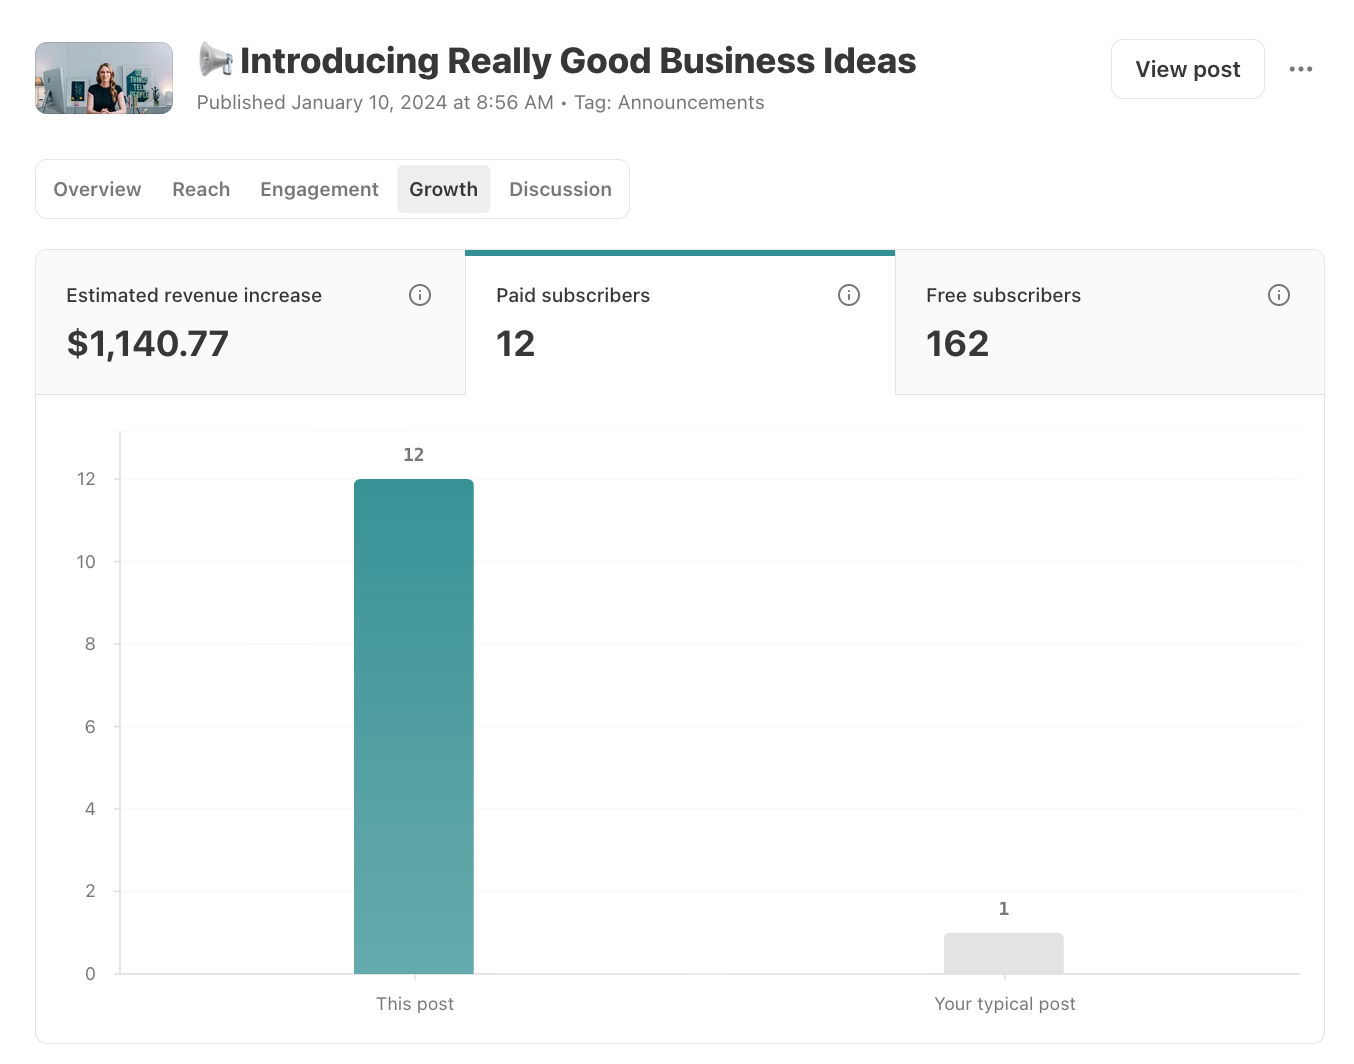
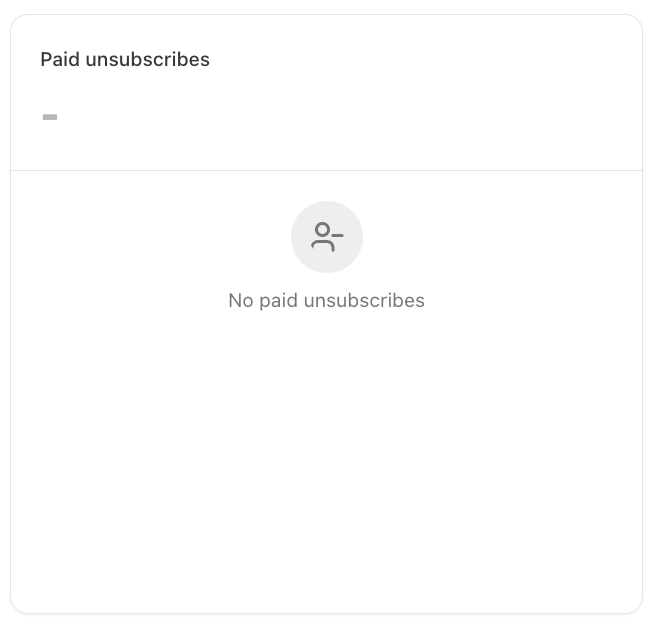
What It Means: Paid subscribers shows the number of new paid subscribers your publication gained from this post. Further down the page, you can also see if any paid subscribers canceled their paid subscription after visiting the post.
How to Use It: Similar to Estimated revenue increase, Paid subscribers helps you identify which posts are converting readers to paid subscribers. The two metrics tell slightly different stories, though, since the revenue a paid subscriber generates depends on which plan they chose.
Free Subscribers
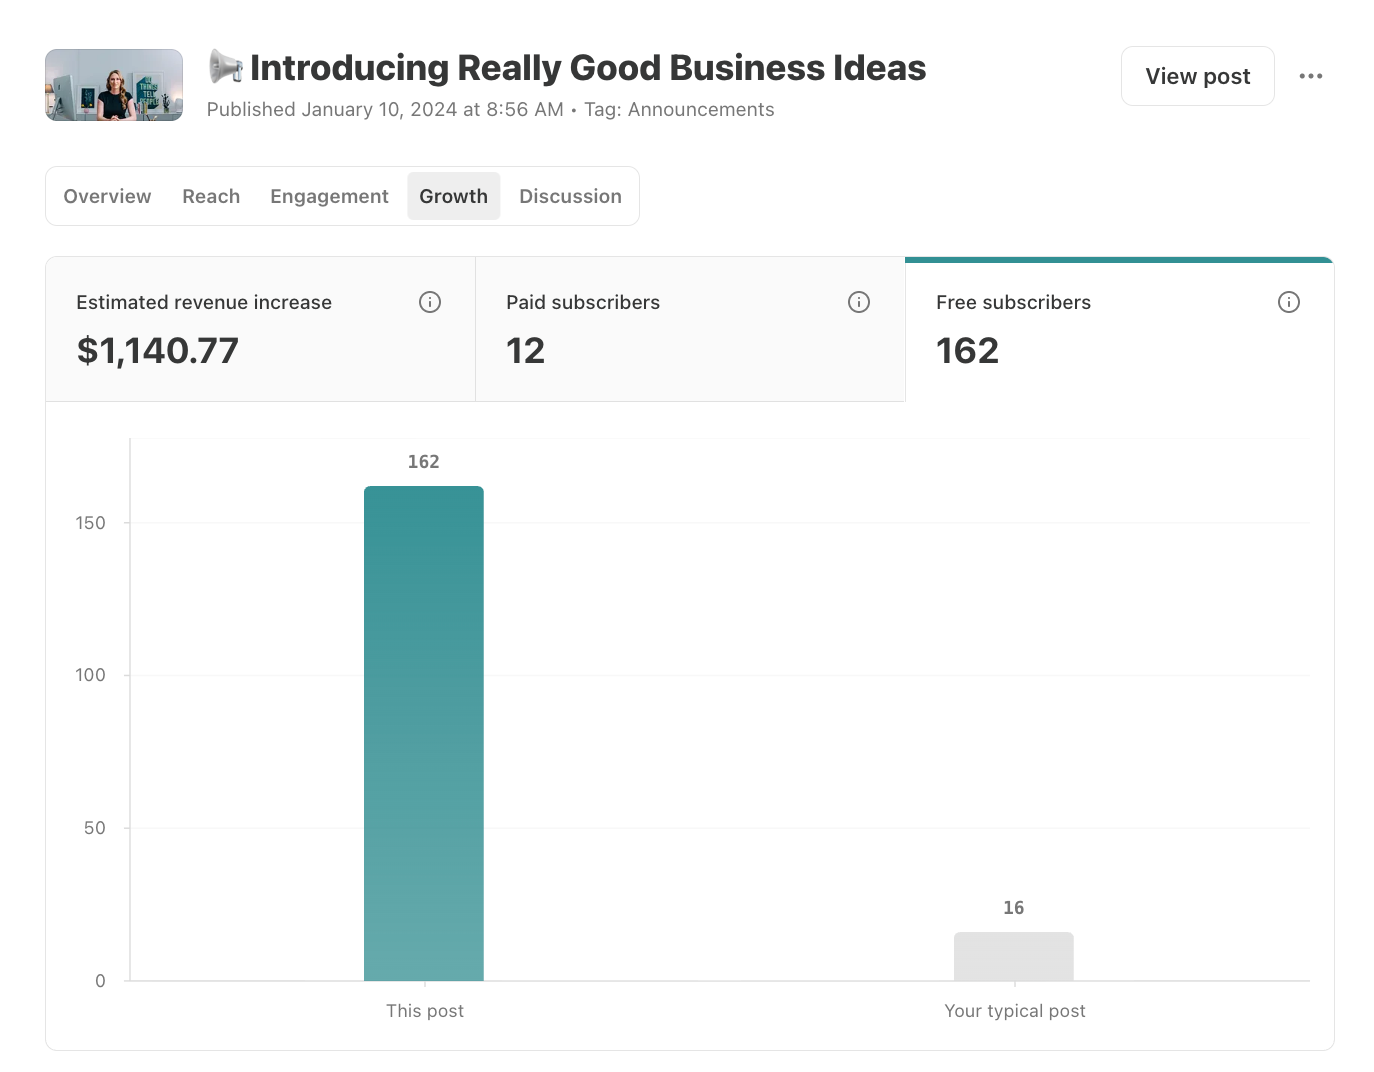
What It Means: Free subscribers shows the number of new free subscribers your publication gained from this post.
How to Use It: Free subscribers reflects an earlier step on the conversion path before paid subscribers, but it’s just as important. Most people won't upgrade to the paid plan right away, so getting them onto your free list first is how you move them into your upgrade funnel. Free posts tend to drive more free subscriber conversions, while paid posts tend to drive more paid conversions, so the mix you see here will typically depend a lot on the specific post you’re looking at.
Discussion

The Discussion tab doesn’t contain metrics, but it's still a useful place to check. You can see all your comments and restacks in one place here, which can be easier to manage than scrolling through the comments section at the bottom of the post, especially when a post gets a lot of activity.
Put Your Post Metrics to Work
Substack’s post stats provide a lot of information about how each piece of content is performing, from how many people received it to which posts are actually driving paid conversions. Not every metric here deserves equal attention, but knowing what each one measures means you can focus on the ones that actually inform your decisions.
Once you’re familiar with Substack post stats, I recommend exploring Substack publication stats to learn more about your audience.
To endless possibilities,
Casandra
Need More Help?
Really Good Business Ideas Premium: A membership designed to make starting and growing a profitable business easier. Full archive access, DM support, and a library of templates and resources.
Substack Creator OS: A complete operating system for planning, writing, growing, and monetizing your newsletter, all in one connected Notion workspace. (Right now, it’s free for Premium subscribers).
Work With Me Directly: Book a 1-on-1 consultation or coaching call to get personalized help when you need it. Think of it as a focused working session to get unstuck, gain clarity, or move something forward.

Good breakdown.
I've used Claude to build an extensive dashboard that gives me really great insights into my email/post stats.
Thanks for the overview, but sigh...this has just made me realise that everytime I open one of my articles (which is a lot for resharing, quoting etc) it's being counted towards my stats...so posts I thought were doing well view wise are being substantially inflated because of me (like a third of views in some cases). Is there a solution to this...can you unsubscribe from yourself?